GUI Component Library
Introduction
GUI Components are the elements of web pages. This document lists MontiGem GUI library components. To see a live demonstration of most components see the demo page.
Each component description includes:
- GUI component usage examples
- GUI component signature, i.e. component name and its input parameters
- A description of each input parameter, including the types and default values
The GUI component library may be used as is to model web pages, or can be composed to create more complex reusable GUI components. For example, layout components can be combined with input components to create forms, or with charts to create dashboards.
Editor components
MonacoEditor
Embeds the Monaco code editor (the editor that powers VS Code), providing syntax highlighting, code decorations, and hover content for a given programming language. Find more options at https://microsoft.github.io/monaco-editor/typedoc/interfaces/editor.IStandaloneEditorConstructionOptions.html
Input components
GemRadioInput
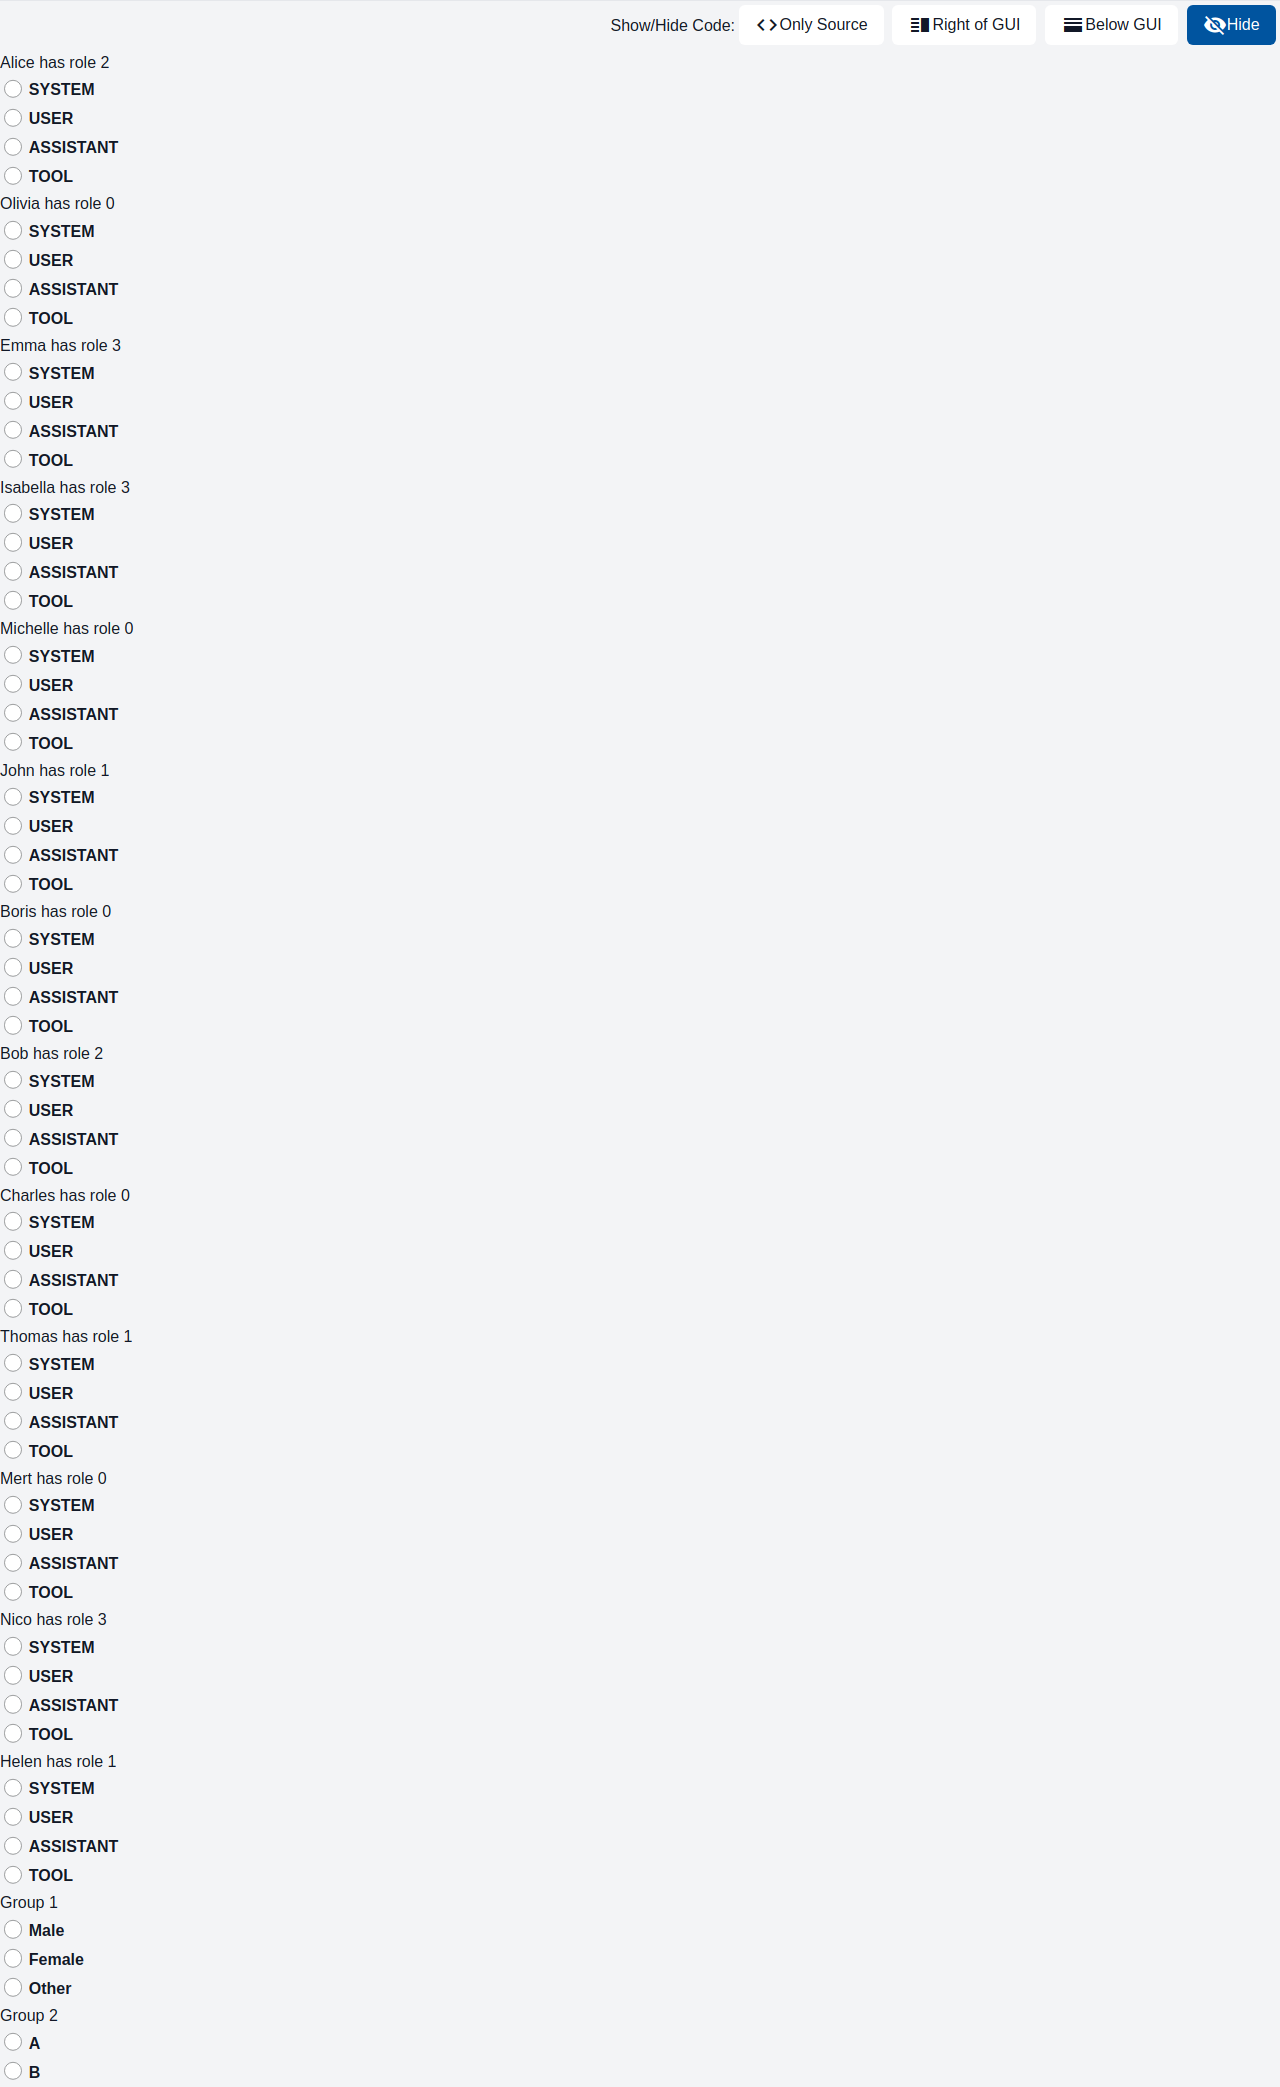
This component represents a radio button with a label. It is intended for use in forms or other scenarios where users must choose one of several options.
GemAutocompleteInput
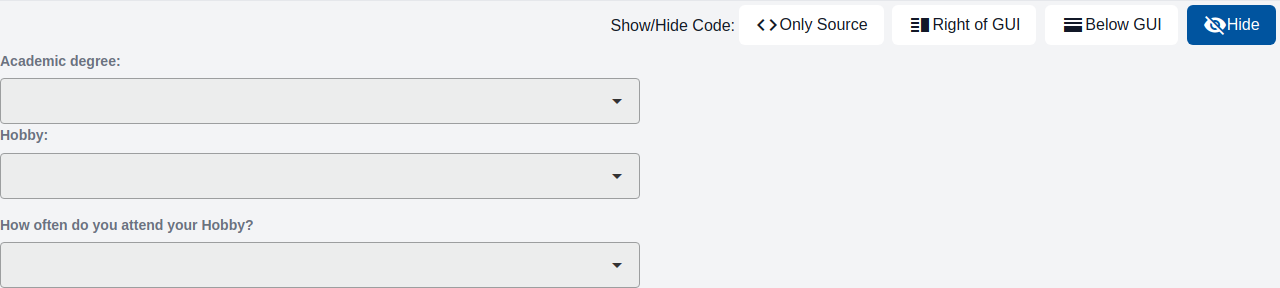
The component is a dropdown field with an optional label. It is used whenever a user input is required, in which the user selects one from multiple options

GemNumberInput
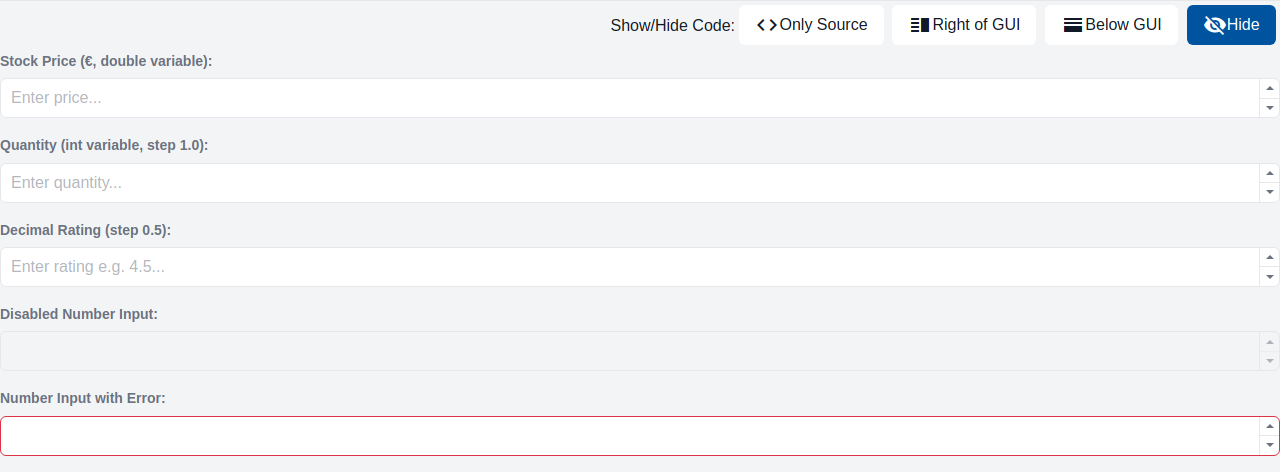
The component is an input field for numeric values with an optional label.
GemTextareaInput
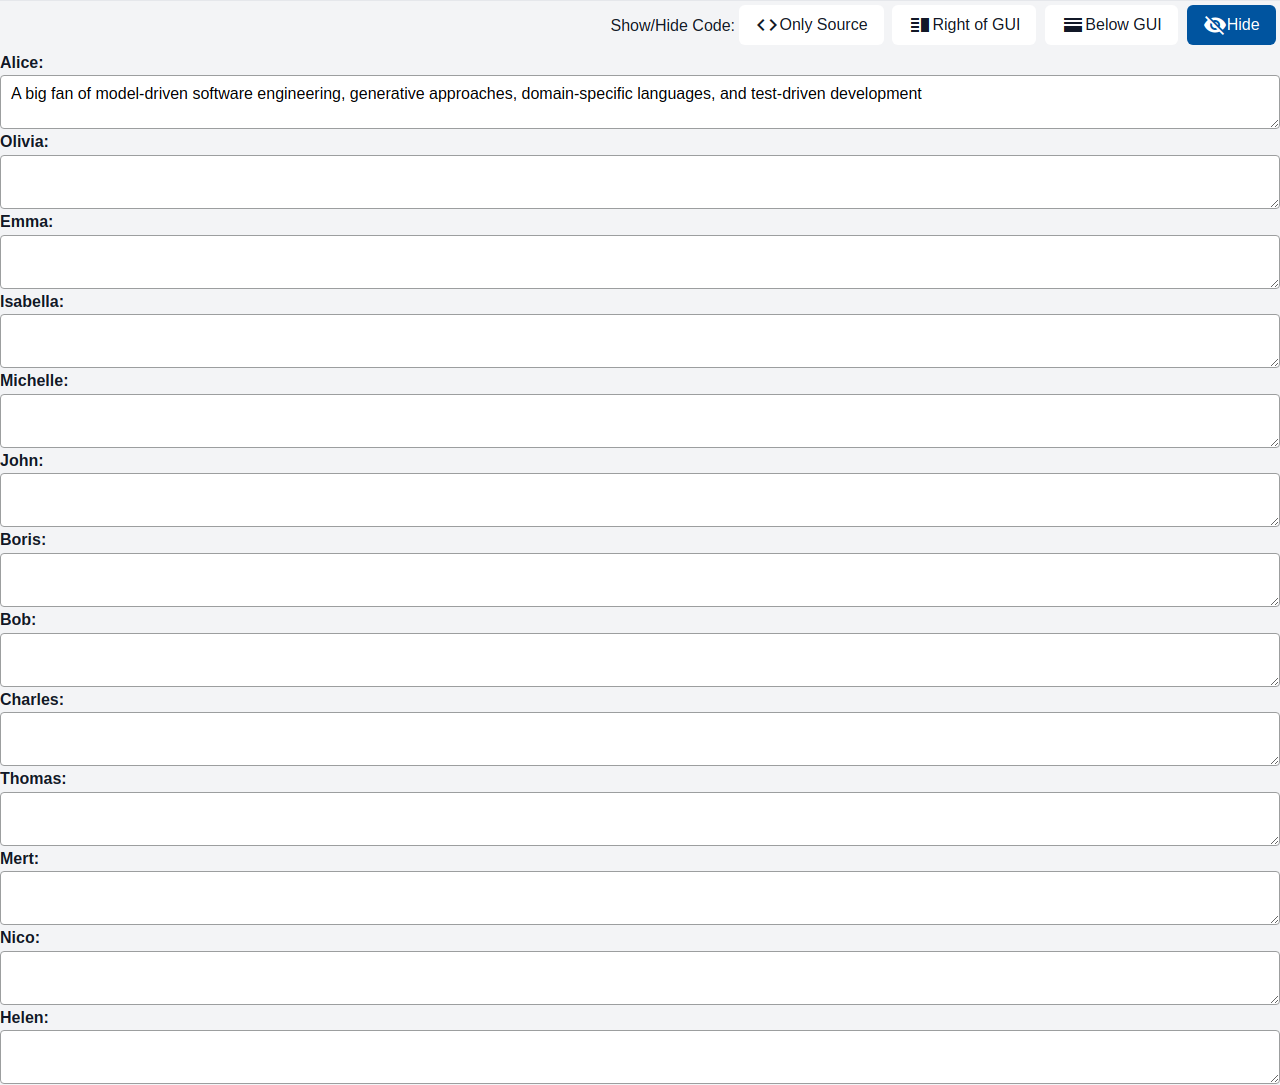
The component is a text area with an optional label. It is used whenever a multi-line user text input is required, e.g. for comment fields, feedback, etc.
GemTextInput
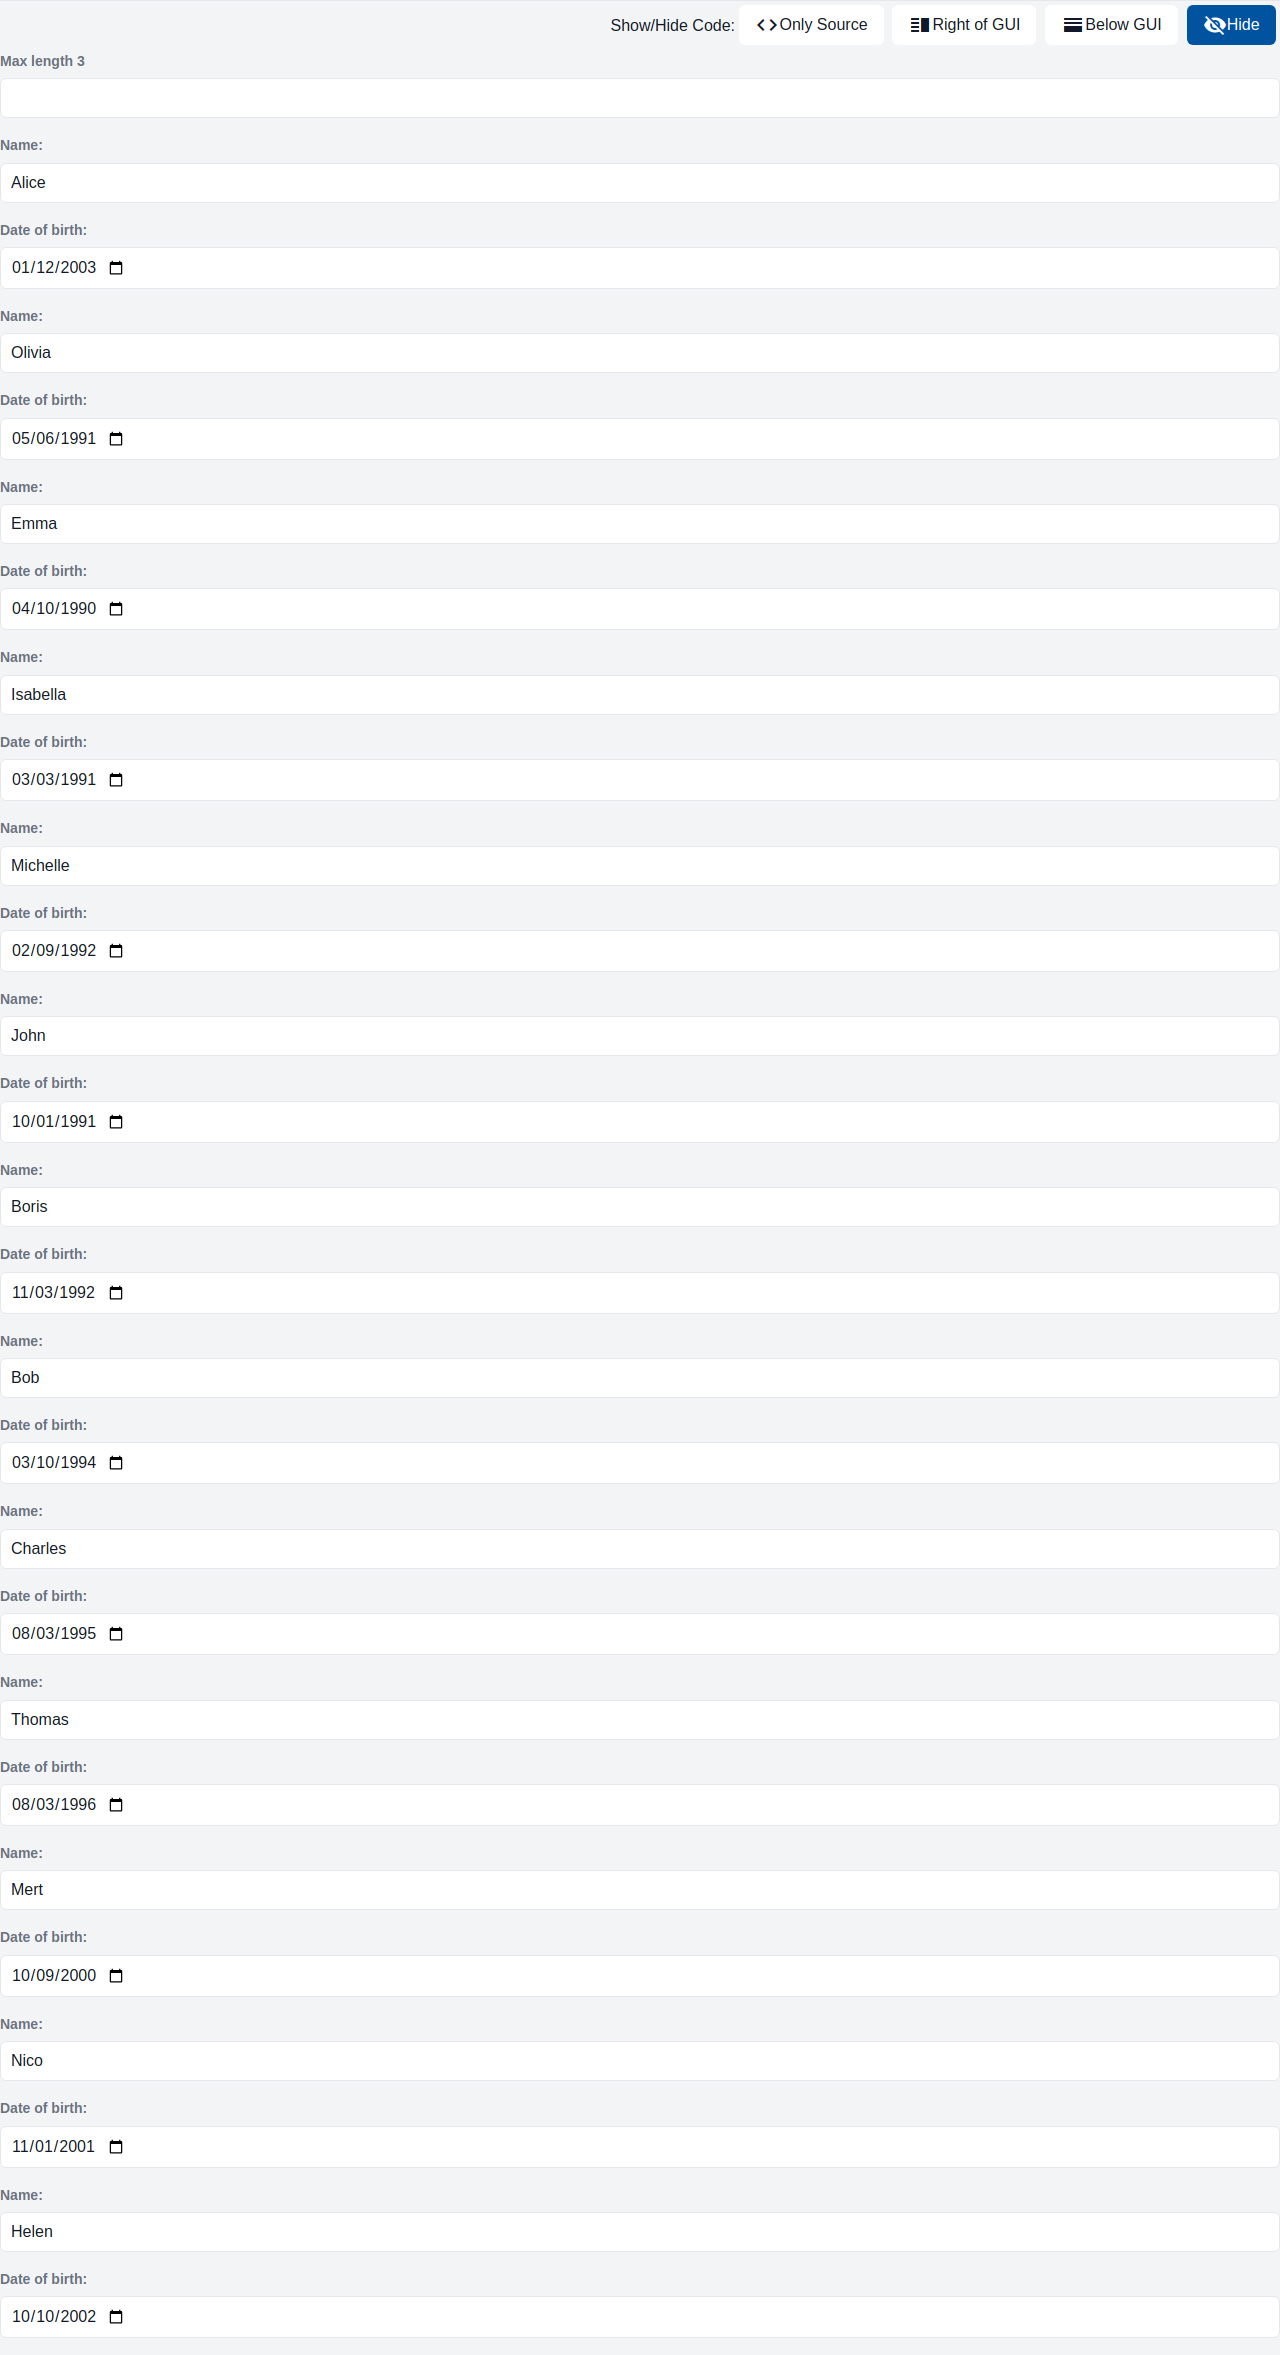
The component is an input field with an optional label. It is used whenever a user input is required, e.g. to create/update objects, provide a search field, etc.
GemDateInput
The component is an input field that shows with an date/time selection overlay that opens on click. It is used whenever a user date/time input is required.
GemDropdownInput
The component is a dropdown field with an optional label. It is used whenever a user input is required, in which the user selects one from multiple options
GemRangeInput
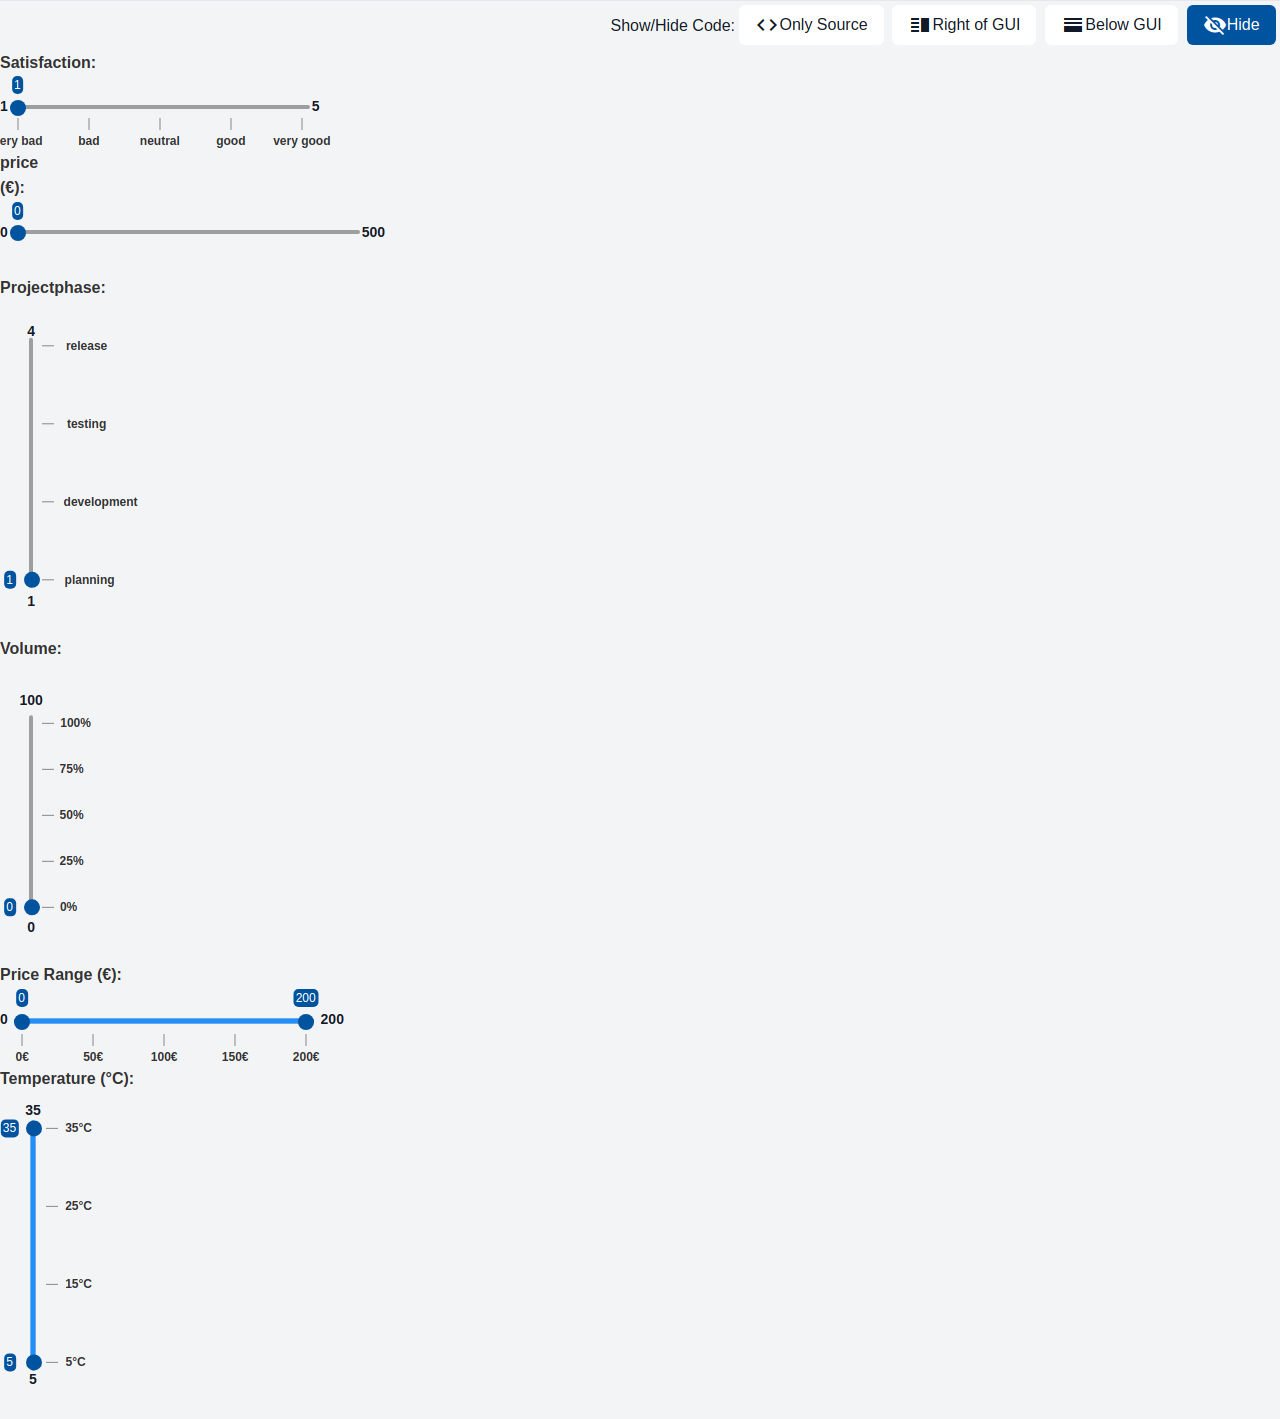
This component displays a label with a slider that allows users to select a value within a specified range. This component can be used in forms and other interactive interfaces to allow users to select a range of values easily.
GemCheckBoxInput
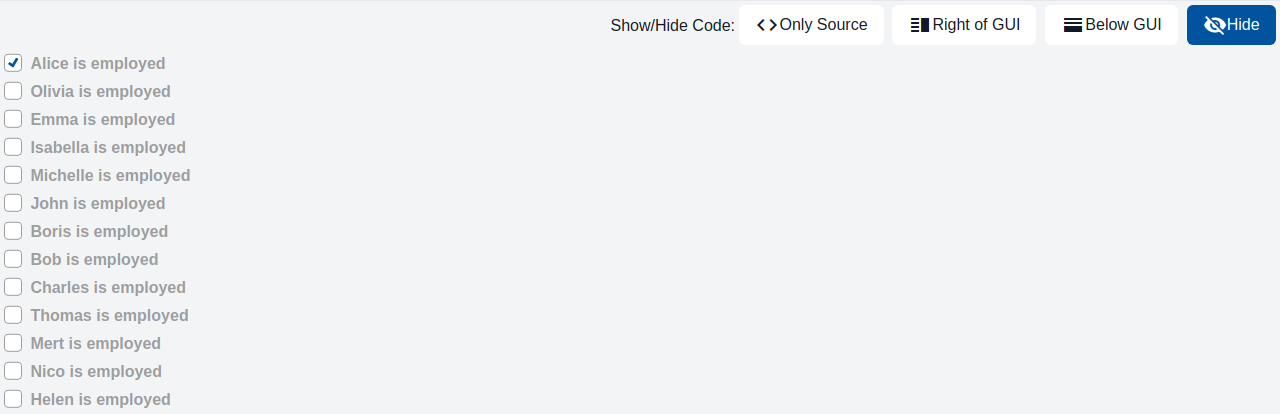
The component is a checkbox with a label. It is used whenever an input for a binary choice is required, e.g., agreeing to terms and conditions or opting in to a newsletter.
GemDualRangeInput
This component displays a label with two slider thumbs that allows users to select a range within a specified slider track. This component can be used in forms and other interactive interfaces to allow users to select a range of values easily
GemFileInput
- The component is an input field for file uploads with an optional label. * The uploaded file will be PUT against the targetURL.
Charts components
GemPieChart
A pie chart, also called circle chart, looks like a circle, which is divided into slices to visualize information. Different categories of data can be indicated by different colors. It is helpful to observe the numerical proportion of data. For example, it can be used to show the market share of competing products, or the distribution of a household budget across expense categories.

GemRadarChart
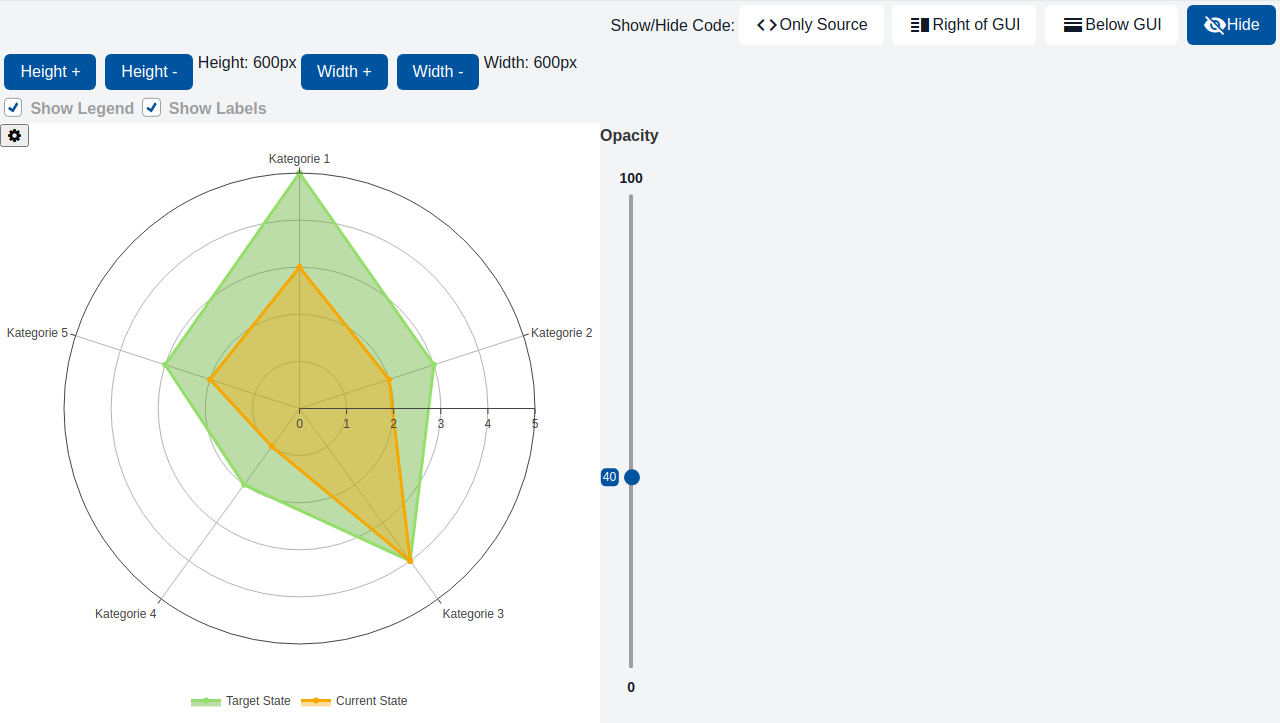
A radar chart is a way of showing multiple data points and the variation between them. They are often useful for comparing the points of two or more different data sets. For example, it can be used to compare the skill ratings of several players across multiple categories, or a product's performance across various criteria.
GemBoxPlot
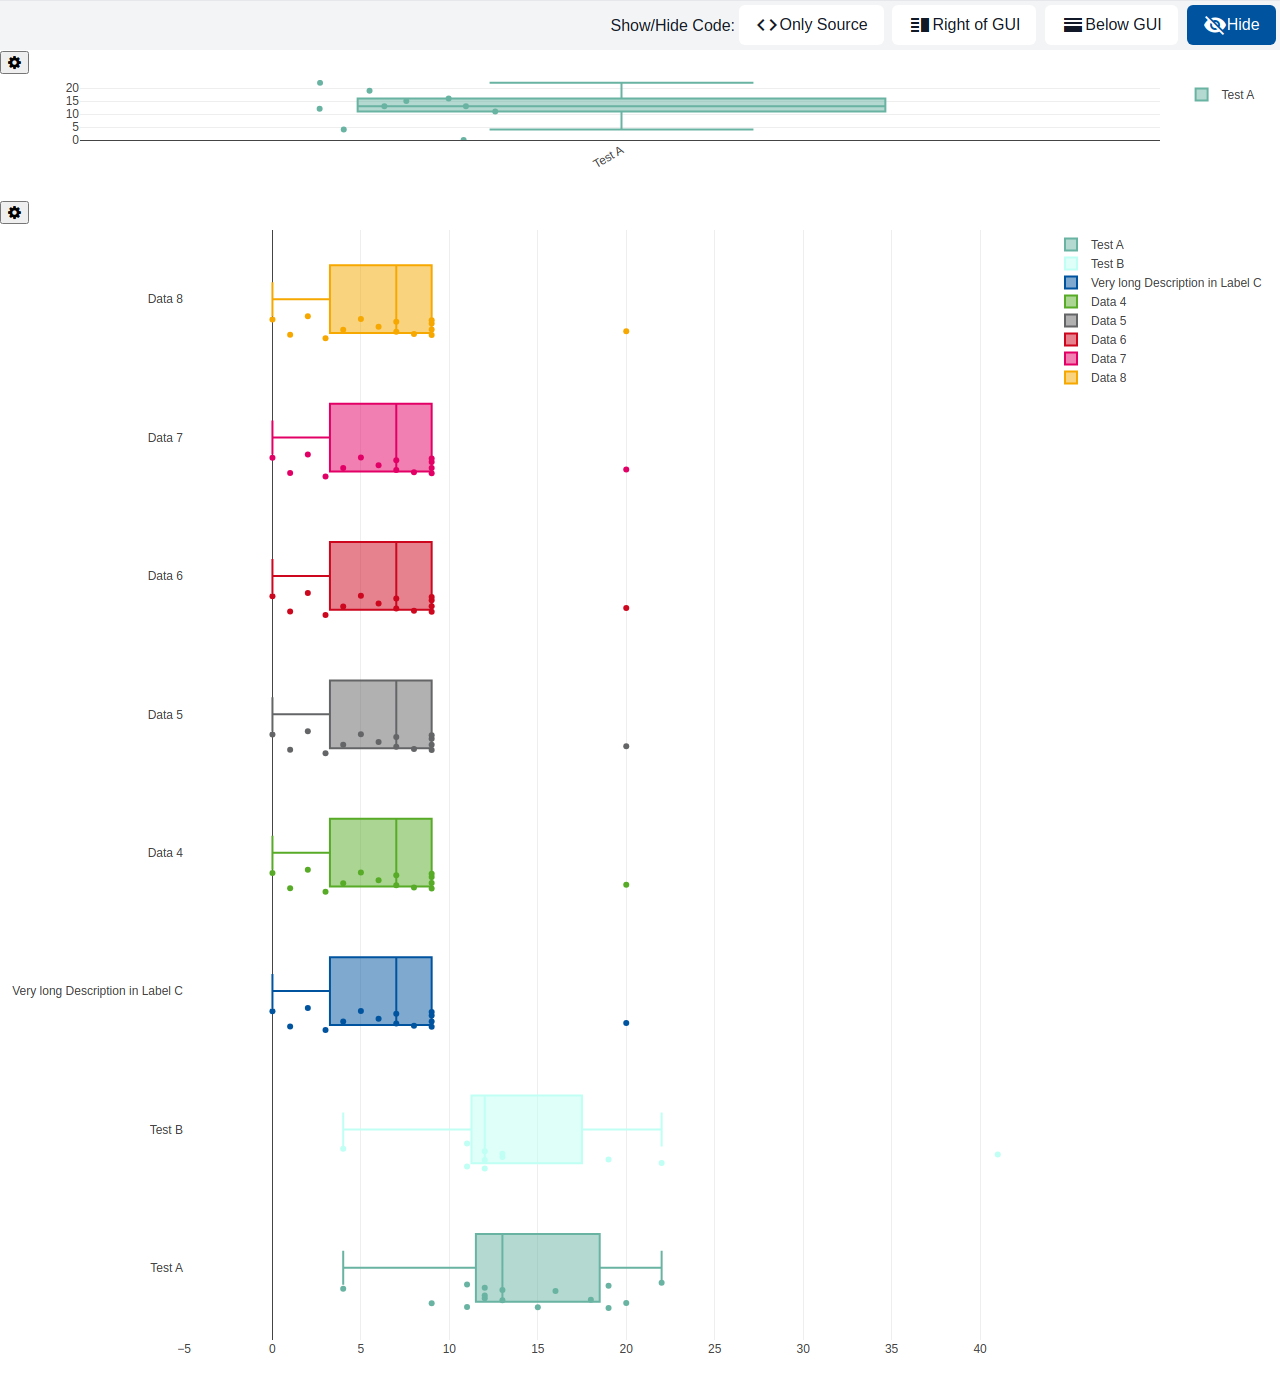
A BoxPlot presents a set of two dimensional data with a number of rectangular boxes + whiskers that represent max, min, median and upper and lower quantiles. The chart itself visualizes categories (given as Strings) on one axis and scalar values on the other as size of the boxes. Additionally, the exact data points can be visualized to get a better idea of the distribution. For example, it can be used to compare exam score distributions across several classes, or to visualize the spread of measured sensor values per device.
GemGaugeChart
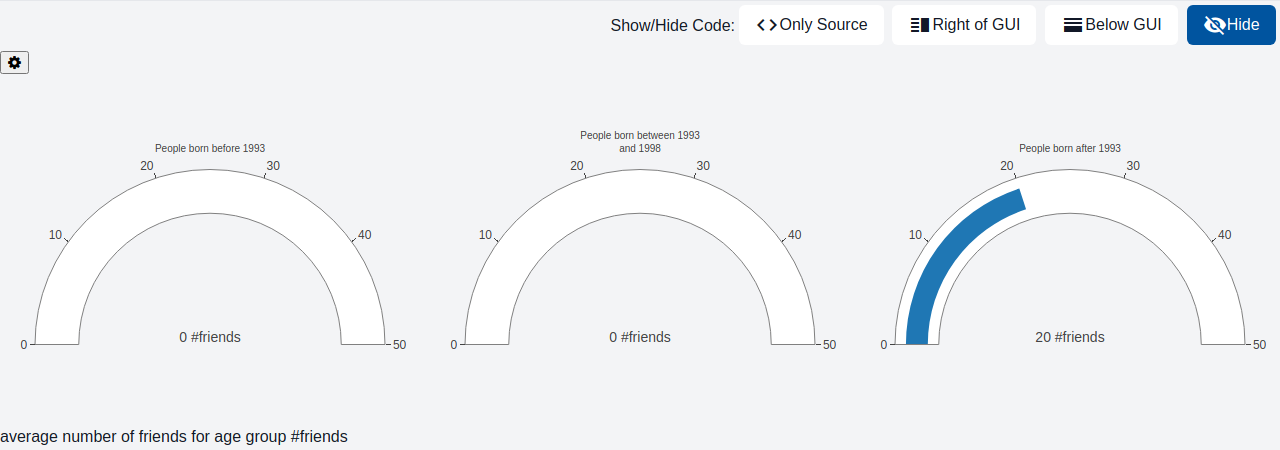
Gauge charts are also known as dial charts or speedometer charts. Normally they consist of a dial and a pointer, use the pointer to read the information. There are several different types of gauge charts, such as Speedometer, Linear Gauge Charts and Angular Gauge Charts. Gauge charts are very helpful to visualize and compare single data value with a quantitative context. For example, it can be used to display the current CPU usage of a server, or the fill level of a tank as a percentage of its capacity.
GemCandlestickChart
A candlestick chart displays important datapoints for a (short) period of time, and is often used to show how stock prices changed over said periods. Each candlestick's horizontal position represents time, while its vertical bar and the line crossing through it represent the opening, closing, highest, and lowest price of that period. The candlestick's color indicates whether the price went up (green) or down (red), which determines whether the top of the bar shows the opening or closing price (and vice versa for the bottom). For example, it can be used to visualize the daily price movements of a stock or cryptocurrency over the course of a month.
GemHeatmapChart
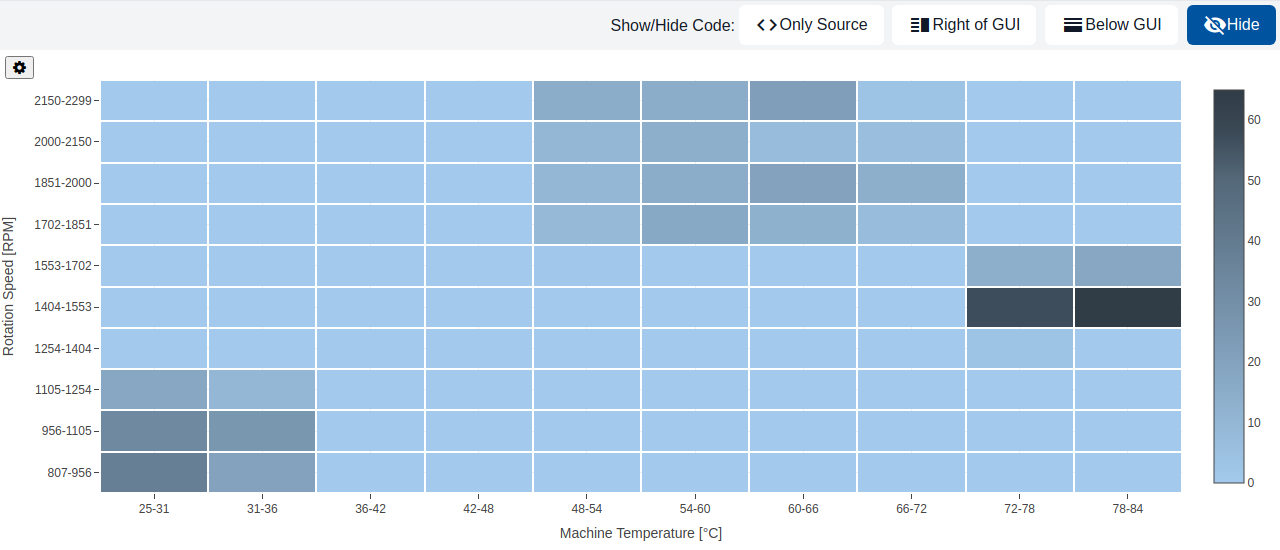
Heatmap charts visualize different kinds of data, for instance temperature, in a tabular-like format. They are helpful for finding patterns, relationships between data or other kind of information. For example, it can be used to visualize average monthly temperatures across several years, or website traffic by hour of day and day of week.
GemLineChart
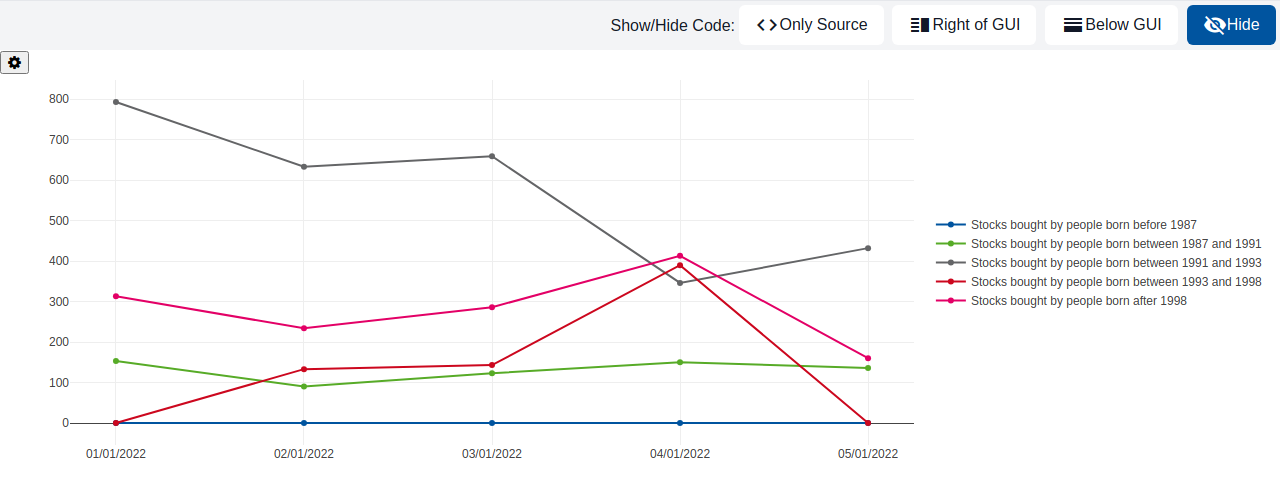
A line chart is a graphical representation to describe the data changes over a given period. It is connected by straight line segments. The horizontal axis is usually a time scale; for example, minutes, hours, days, months, or years, while the vertical axis would have the values. For example, it can be used to show a stock's price over the past year, or the temperature measured by a sensor throughout a day.
GemSunburstChart
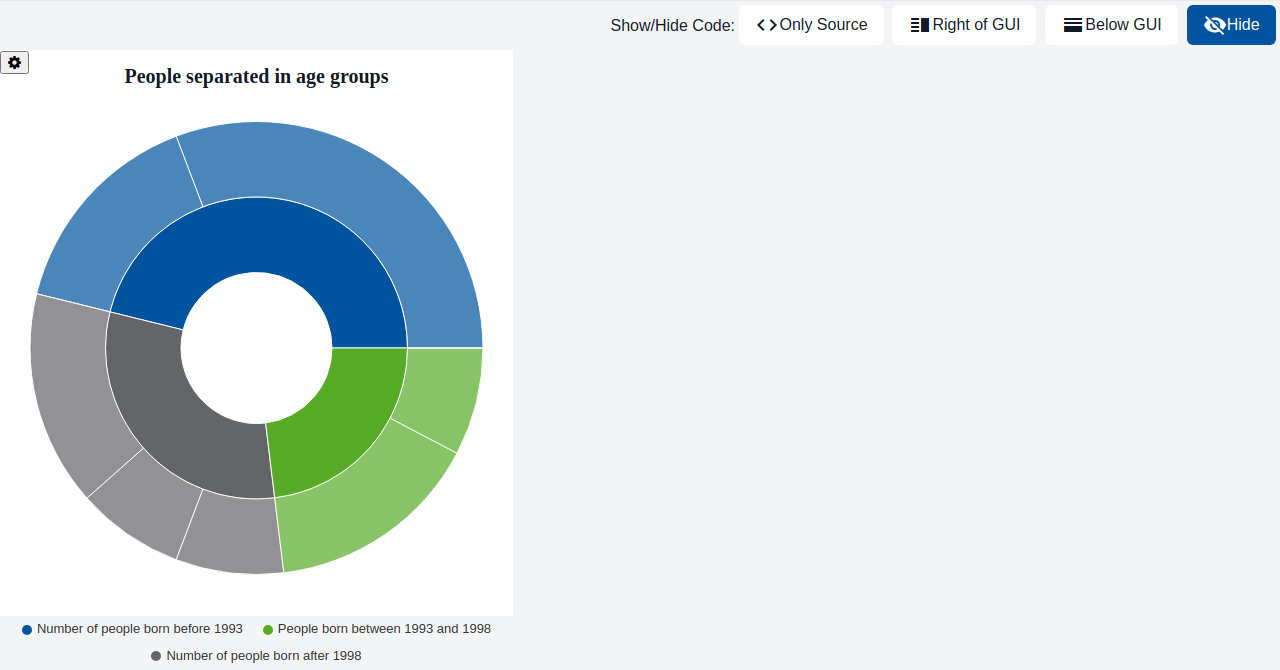
Sunburst charts look like pie charts with multiple layers. Each of them refines the information of the previous layer and gives information about the distribution of the parent layer in percent. The sunburst chart can also be represented by a tree-like structure with parent nodes and subnodes which contain the refined information about the parent nodes. Unlike a GemPieChart, which only shows a single layer of categories, a sunburst chart is useful when the data has a hierarchical structure with multiple nested levels that should be shown at once. For example, it can be used to visualize the folder structure of a file system, or the breakdown of a company's revenue by region and then by product line.
GemTimeSeriesChart
A time series chart is a data visualization tool that plots data points at successive intervals of time. It is used to show how data changes over time. For example, it can be used to monitor a machine's live sensor readings, or to display historical stock prices annotated with relevant news events.
GemBarChart
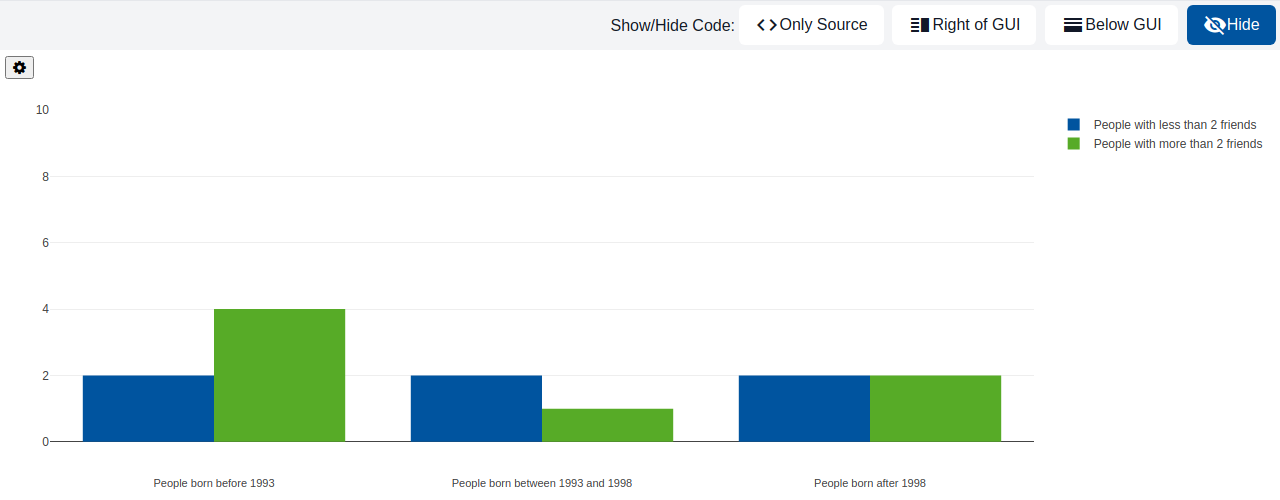
A bar chart displays a value for each category as a rectangular bar, either horizontally or vertically, with the bar's length or height being proportional to its value. Categories are shown as Strings on one axis, and their values as integers on the other. If a category has multiple sub-categories (a second data dimension), their bars can additionally be stacked on top of each other or aligned side by side. For example, it can be used to compare monthly sales figures across different product categories, or to show stacked survey results (e.g. "agree", "neutral", "disagree") per question.
GemScatterPlot
A scatter plot visualizes a set of scattered points in a two dimensional space. The axes have a certain range and provide more detail with a title. For example, it can be used to visualize the correlation between a person's height and weight, or between advertising spend and sales revenue. It can also be used to show the distribution of exam scores against hours studied.

GemChartLegend
GemChartLegend displays a legend mapping a list of labels to their corresponding colors, typically used alongside another chart component. For example, it can be placed next to a GemPieChart or GemSunburstChart to explain which color represents which category.
GemVennDiagram
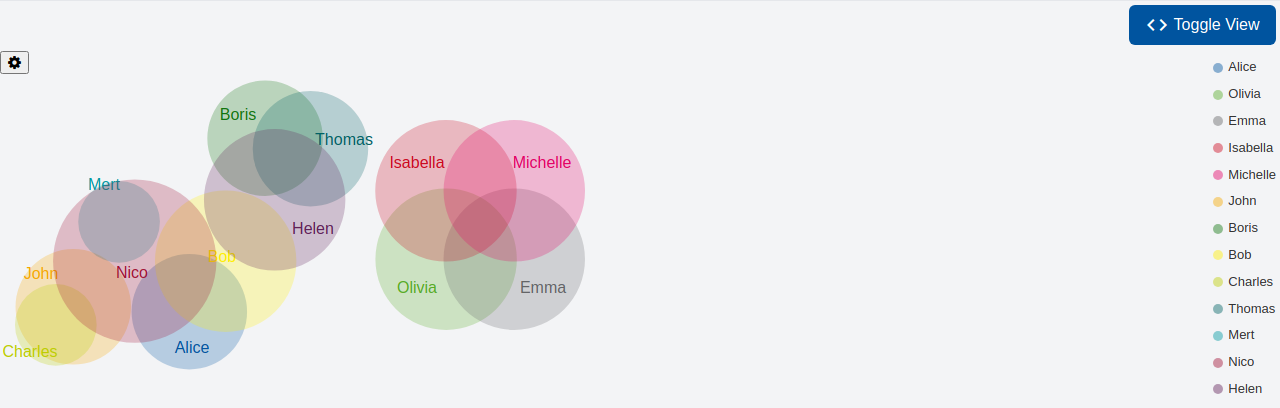
A Venn (Euler) diagram is a diagram style that shows the logical relation between sets. It is used to teach elementary set theory, and to illustrate simple set relationships in probability, logic, statistics, linguistics and computer science. For example, it can be used to show the overlap between customer segments who bought different products, or the shared skills between team members.
GemBulletChart
A bullet chart is a variation of the bar chart. It features a single, primary measure, compares that measure to one or more other measures to enrich its meaning (for example, compared to a target), and displays it in the context of qualitative ranges of performance, such as poor, satisfactory, and good. For example, it can be used as a KPI widget on a dashboard, showing this month's revenue against its target, or to display progress towards a project deadline.
GemTimelineChart
A timeline chart visualizes one or more series of time-bound blocks (e.g. tasks or events) along a shared time axis, making it easy to compare their durations and overlaps. For example, it can be used to visualize a project's task schedule (Gantt-style), the booking periods of several rooms in a hotel, or the operating and downtime periods of machines in a Digital Twin.
Navigation components
GemNavList
GemNavList renders a vertical navigation list, e.g. for a sidebar menu. It arranges navigation entries such as GemNavItem between an optional header and footer.
GemNavItem
GemNavItem renders a single, clickable entry of a GemNavList, e.g. a link to another page of the application.
Arrange components
GemOverlay
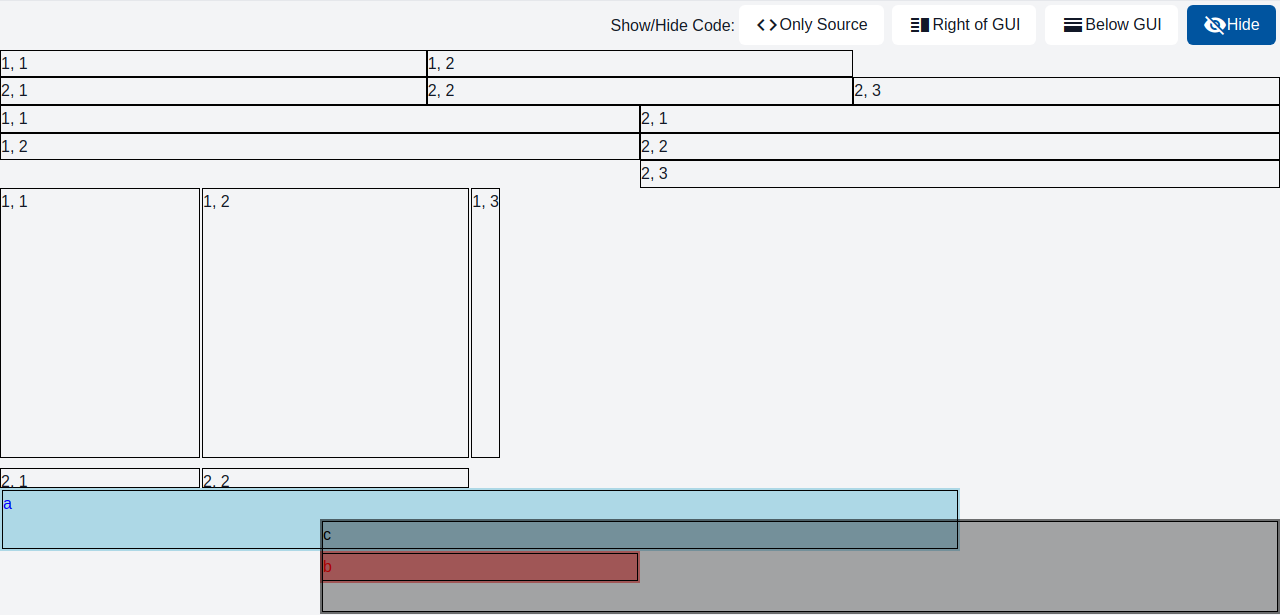
GemOverlay stacks a set of freely positioned components on top of a background component, typically combined with GemOverlayItem to position each element.
GemRow
GemRow is a container which arranges input elements horizontally.

GemGridCell
GemGridCell controls dimensions that content should occupy within a GemGrid
GemCard
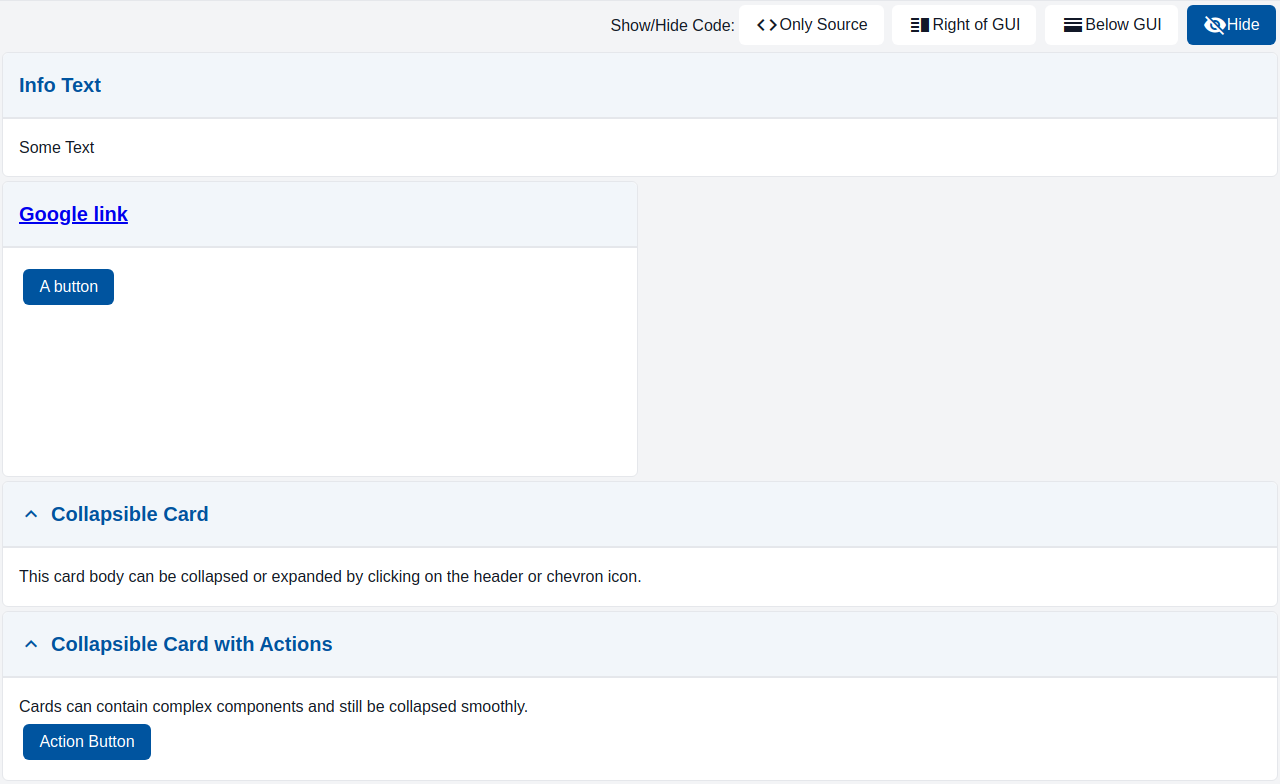
Card is a container with a header and a body. Both header and body may contain any elements, such as button, inputs, charts, etc.
GemColumn
GemColumn is a container which arranges input elements vertically.

GemTreeNode
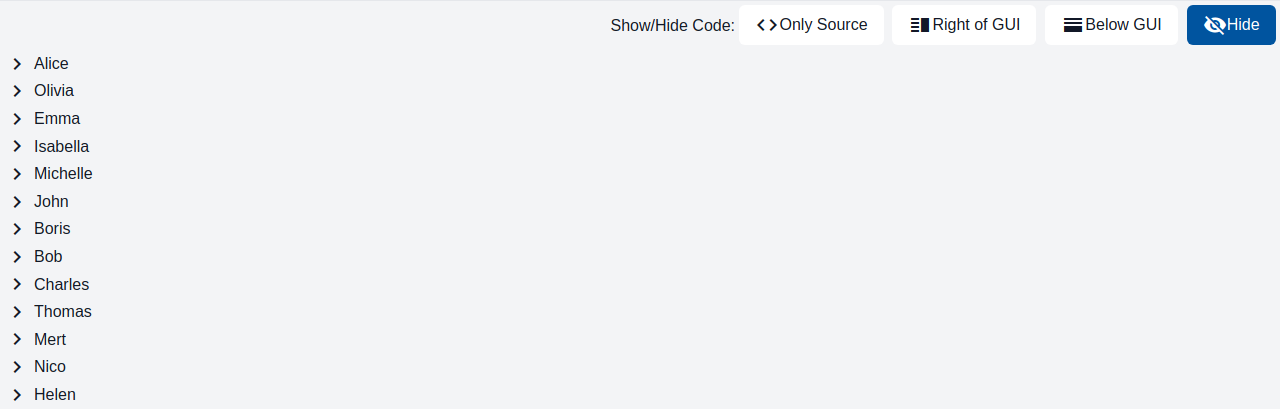
Combine multiple tree nodes to a tree. A tree displays hierarchical data. It provides a visual representation of parent-child relationships, allowing users to navigate and interact with a hierarchical dataset.
GemDialog
GemDialog displays a component as a modal dialog on top of the page at a configurable position, optionally with a backdrop.

GemOverlayItem
GemOverlayItem positions a single component at absolute x/y coordinates within a GemOverlay.
GemGrid
GemGrid is a container which arranges input elements in a grid pattern.
Functiondisplay components
FunctionDisplay
FunctionDisplay component for rendering C&C models.
Networkgraph components
GemGraph
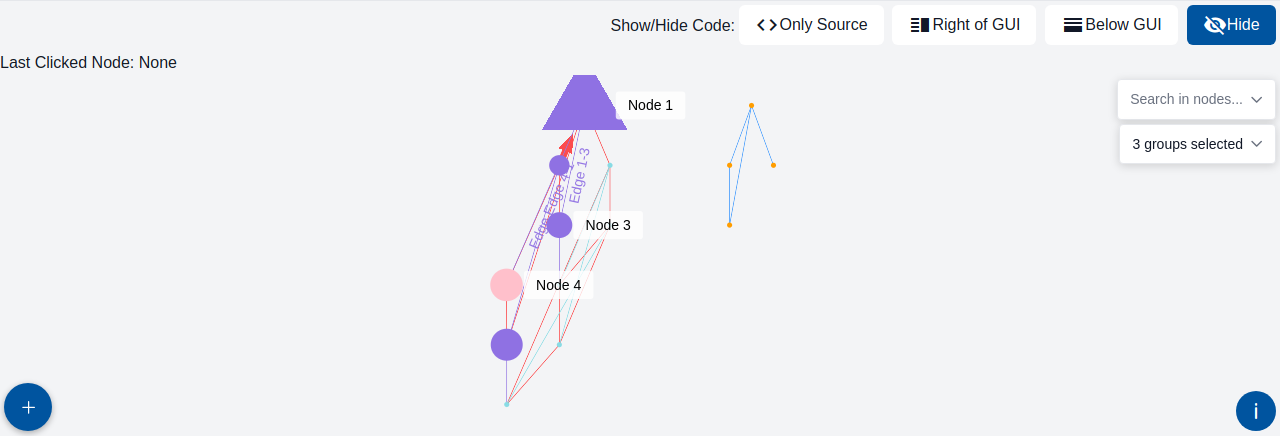
GemGraph is a graphical representation of a network. It is composed of nodes and edges. Nodes are the entities of the network, and edges are the relationships between the nodes.
Cad components
GemCAD
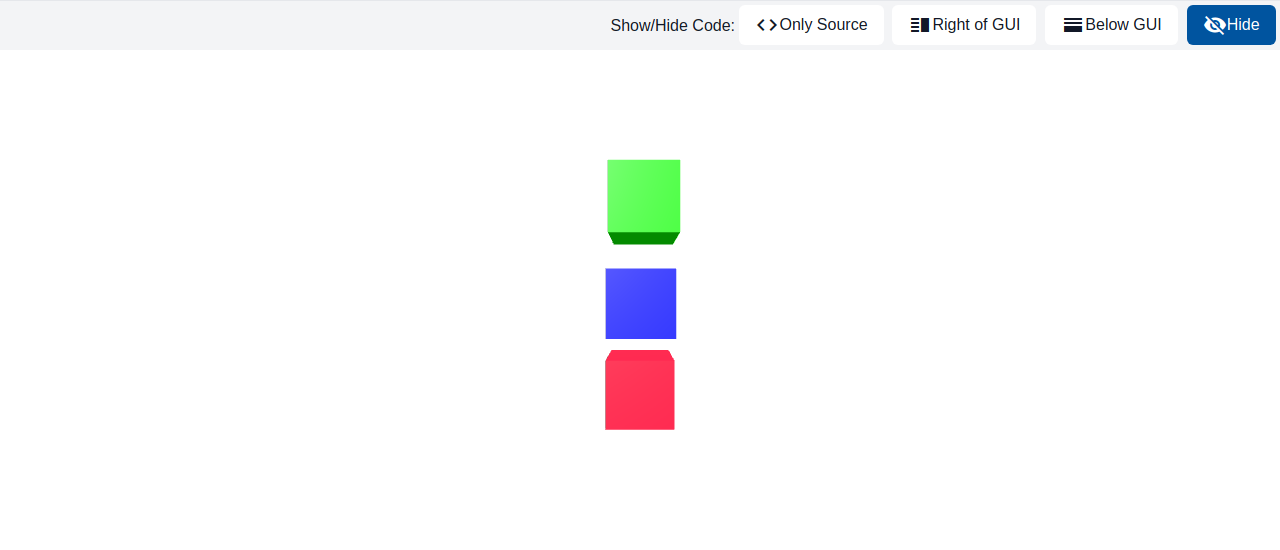
This component renders a 3D CAD model and facilitates user interaction through node selection and marker overlays.
Basic components
GemButton
Button enables user interaction through simple clicks or taps, triggering actions or tasks.

GemDarkModeSwitch
A switch component to toggle between light and dark modes.
GemText
Displays text on a webpage.

GemLink
The link element is used to create a hyperlink to another web page or to a specific section within a page.

GemTooltip
Tooltip shows a short text when the user hovers over or focuses the wrapped component.
GemImage
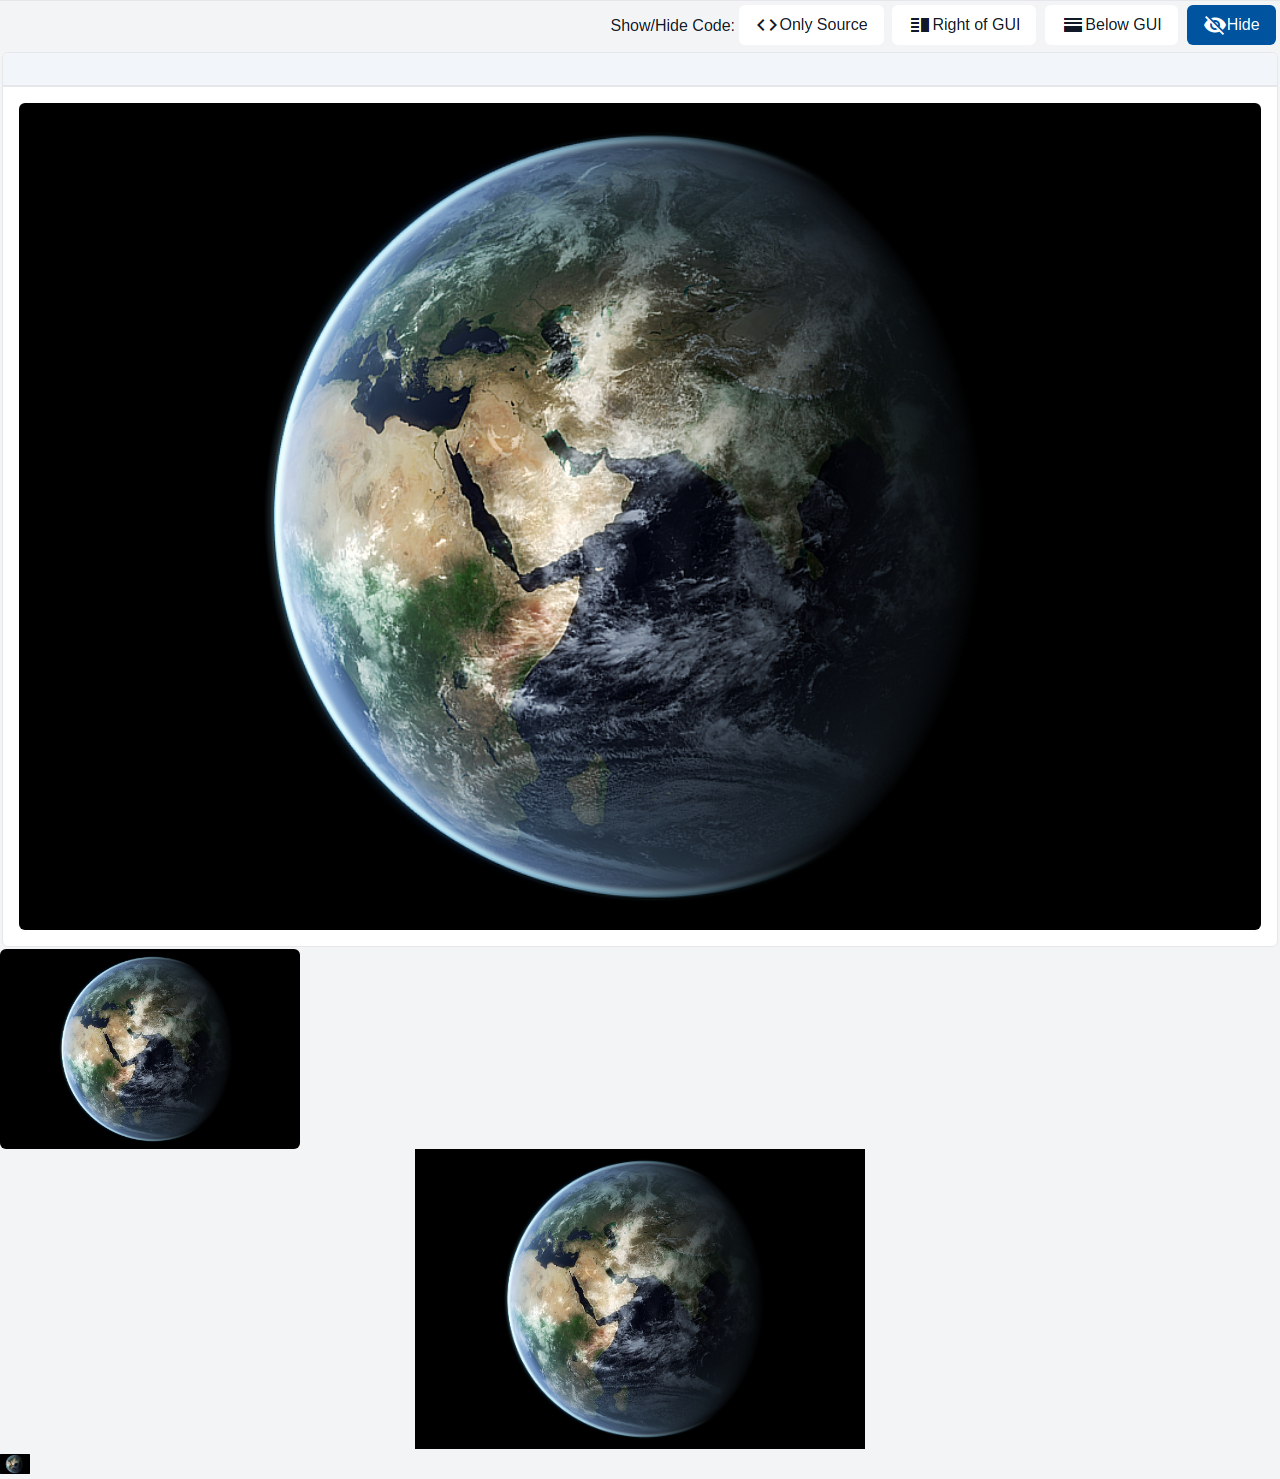
The image component embeds image on a page.
GemIcon
Displays an icon on a webpage.

GemCheckbox
This component represents a checkbox with a label. It is designed to be used in forms or other contexts where the user needs to indicate a binary choice, such as agreeing to terms and conditions or opting in to a newsletter. A single instance of the component results in a single checkbox input.
GemLoadingSpinner
Visualizes a loading process or a wait state within the user interface. This component indicates that the system is currently processing a request and may operate in either a determinate or indeterminate mode.
GemAudio
The audio component embeds sound content on a page.

GemVideo
The component shows a video on a web page.
Fischertechnik components
Conveyor
Visualizes the fischertechnik conveyor station, showing the direction the belt is moving in and whether a workpiece is detected at either end.
Warehouse
Visualizes the fischertechnik warehouse (high-bay storage) station, showing the position of its crane along the three axes of the storage rack.
VacuumGripper
Visualizes the fischertechnik vacuum gripper station, showing the position of the gripper arm, its reference switches, and the state of the vacuum pump and valve.
MultiProcessingStation
Visualizes the fischertechnik multi-processing station, showing the sensor states (reference switches, light barriers) and the actuator states (motors, valves) of the turntable, conveyor, saw, oven, and vacuum gripper.
SortingLine
Visualizes the fischertechnik sorting line station, showing the belt, the pneumatic pushers, the light barriers, and the detected color of the workpiece.
Table components
GemTableHeaderCell
GemTableHeaderCell controls dimensions that content should occupy within a GemTable's header.
GemTableHeader
A table row that identifies the head of the table, adds some default styling to text content.
GemTableRow
A table row that is part of the body of the table.
GemTable
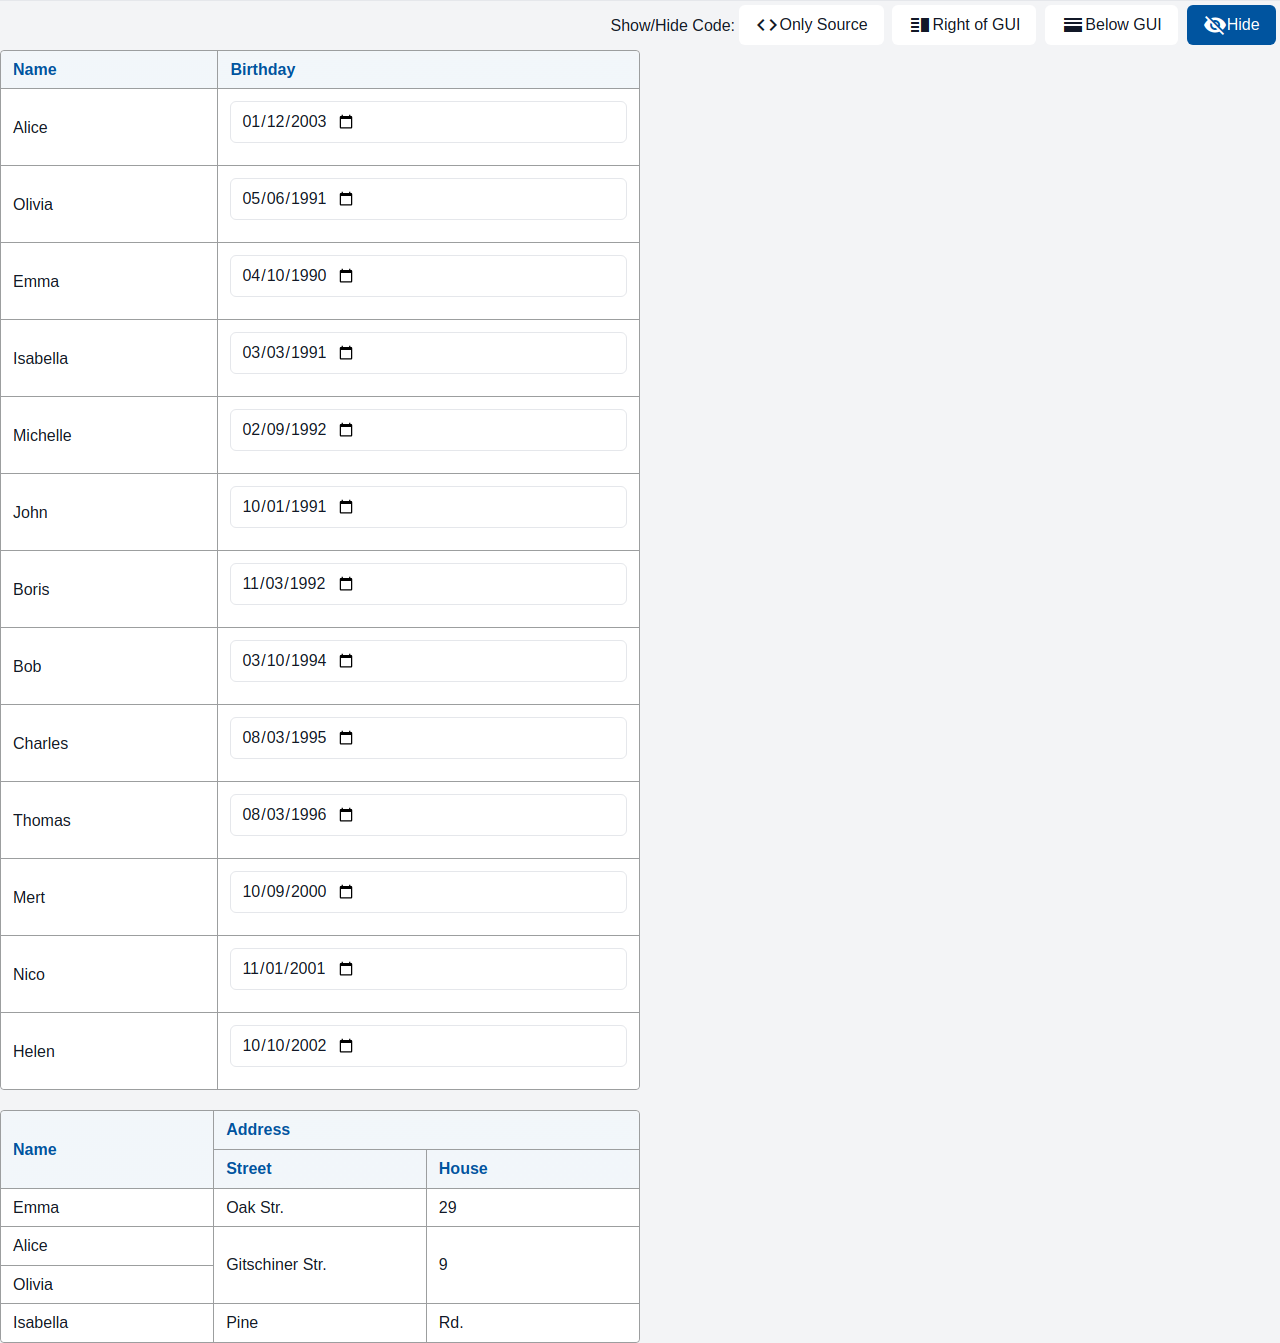
A table organizes and displays data in rows and columns.
GemTableRowCell
GemTableRowCell controls dimensions that content should occupy within a GemTable's body.