GemLineChart
A line chart is a graphical representation to describe the data changes over a given period. It is connected by straight line segments. The horizontal axis is usually a time scale; for example, minutes, hours, days, months, or years, while the vertical axis would have the values. For example, it can be used to show a stock's price over the past year, or the temperature measured by a sensor throughout a day.
Usage Example
/* (c) https://github.com/MontiCore/monticore */
package example_charts;

import Domain.Person;
import mc.fenix.charts.GemLineChart;
import common.ExamplePage;
import mc.fenix.arrange.GemRow;

page GemLineChartExample(List<Person> persons) {
  @ExamplePage(
    component = @GemRow(height = "450px", components = [
      linechart@GemLineChart(
        data = null,
        enableBackgroundColor = false,
        maxValue = null,
        minValue = null,
        showConfig = true
      )
    ]),
    basePath = "example_charts",
    componentName = "GemLineChartExample"
  );
}
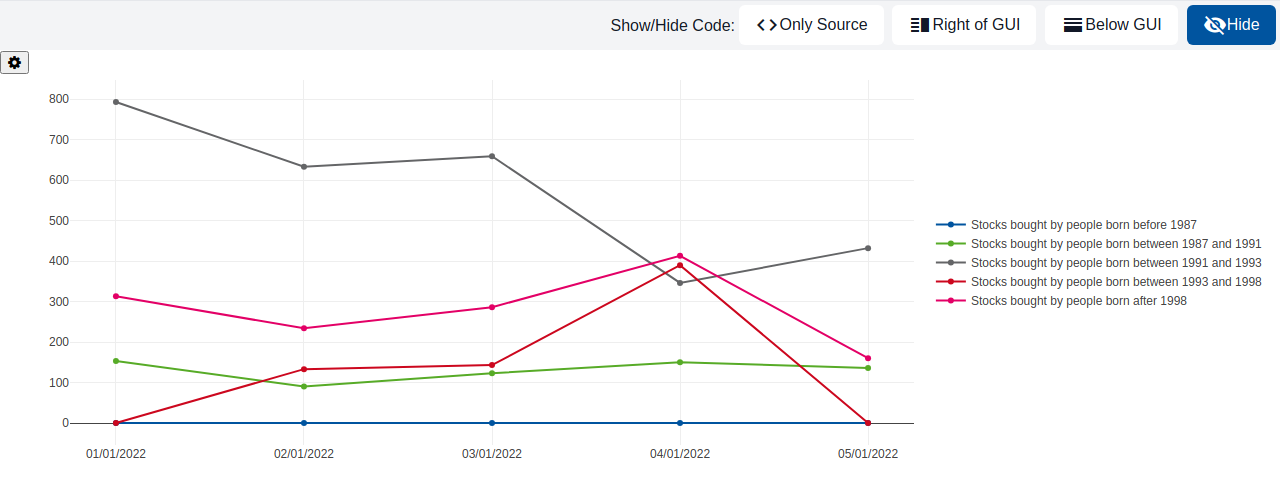
TypeScript implementation:
/* (c) https://github.com/MontiCore/monticore */
package example_charts;

import com.google.common.collect.Lists;
import domain.Person;
import domain.Stock;
import mc.fenix.charts.gemlinecharttypes.GemLineChartData;
import mc.fenix.charts.gemlinecharttypes.GemLineChartDataBuilder;
import mc.fenix.charts.gemlinecharttypes.GemLineChartEntry;
import mc.fenix.charts.gemlinecharttypes.GemLineChartEntryBuilder;
import umlp.jsweet.extension.annotation.Component;

import java.util.ArrayList;
import java.util.Arrays;
import java.util.HashMap;
import java.util.List;
import java.util.Map;
import java.util.Optional;
import java.util.stream.Collectors;

@Component
public class GemLineChartExample extends GemLineChartExampleTOP {

  @Override
  public GemLineChartData getLinechartData() {
    if (this.getPersons() == null) {
      return null;
    }

    List<GemLineChartEntry> entries = new ArrayList<>();
    List<String> labels = Lists.newArrayList("01/01/2022", "02/01/2022", "03/01/2022", "04/01/2022", "05/01/2022");

    Map<String, List<Person>> ageGroups = new HashMap<>();
    List<Person> before_1987 = new ArrayList<>();
    List<Person> between_1987_and_1991 = new ArrayList<>();
    List<Person> between_1991_and_1993 = new ArrayList<>();
    List<Person> between_1993_and_1998 = new ArrayList<>();
    List<Person> after_1998 = new ArrayList<>();

    for (Person person : this.getPersons()) {
      int birthday = person.getBirthday().getYear();
      if (birthday < 1987) {
        before_1987.add(person);
      }
      else if (birthday < 1991) {
        between_1987_and_1991.add(person);
      }
      else if (birthday < 1993) {
        between_1991_and_1993.add(person);
      }
      else if (birthday < 1998) {
        between_1993_and_1998.add(person);
      }
      else {
        after_1998.add(person);
      }
    }

    ageGroups.put("before 1987", before_1987);
    ageGroups.put("between 1987 and 1991", between_1987_and_1991);
    ageGroups.put("between 1991 and 1993", between_1991_and_1993);
    ageGroups.put("between 1993 and 1998", between_1993_and_1998);
    ageGroups.put("after 1998", after_1998);

    for (Map.Entry<String, List<Person>> entry : ageGroups.entrySet()) {
      double[] stocks = {0, 0, 0, 0, 0};
      for (Person person : entry.getValue()) {
        for (Stock stock : person.getStocksList()) {
          switch (stock.getDate().getDayOfMonth()) {
            case 1: {
              stocks[0] += stock.getPrice();
              break;
            }
            case 2: {
              stocks[1] += stock.getPrice();
              break;
            }
            case 3: {
              stocks[2] += stock.getPrice();
              break;
            }
            case 4: {
              stocks[3] += stock.getPrice();
              break;
            }
            case 5: {
              stocks[4] += stock.getPrice();
              break;
            }
          }
        }
      }
      String ageGroupname = entry.getKey();
      List<Double> list = new ArrayList<>();
      for (double stock : stocks) {
        Double i = stock;
        list.add(i);
      }
      Optional<GemLineChartEntry> chartEntry = new GemLineChartEntryBuilder().data(list).label("Stocks bought by people born " + ageGroupname).build();
      chartEntry.ifPresent(ce -> entries.add(ce));
    }

    GemLineChartData data = new GemLineChartDataBuilder()
        .entries(entries).labels(labels).build().get();
    return data;
  }

}
GUI Model
component GemLineChart(
  GemLineChartData data,
  Object displayValue,
  Boolean enableBackgroundColor,
  Integer maxValue,
  Integer minValue,
  boolean showConfig = false
)
| Name |
Type |
Description |
Default value |
data |
GemLineChartData |
The data to be displayed in the chart. |
|
displayValue |
Object |
Configures how the value of each data point is displayed, e.g. as a label. |
|
enableBackgroundColor |
Boolean |
Whether the area under the line is filled with a background color. |
|
maxValue |
Integer |
Maximum value shown on the value axis. |
|
minValue |
Integer |
Minimum value shown on the value axis. |
|
showConfig |
boolean |
Whether the chart's configuration panel is shown. |
false |
Types
GemLineChartTypes
package mc.fenix.charts;
import java.util.List;

<<pojoCD>>
classdiagram GemLineChartTypes {

  public class GemLineChartData {
    List<GemLineChartEntry> entries;
    List<String> labels;
  }

  public class GemLineChartEntry {
    String label;
    List<Double> data;
    String borderColor;
    String backgroundColor;
    String pointBackgroundColor;
  }

}
GemLineChartData
| Name |
Type |
Description |
Default value |
entries |
List<GemLineChartEntry> |
|
|
labels |
List<String> |
|
|
GemLineChartEntry
| Name |
Type |
Description |
Default value |
label |
String |
|
|
data |
List<Double> |
|
|
borderColor |
String |
|
|
backgroundColor |
String |
|
|
pointBackgroundColor |
String |
|
|