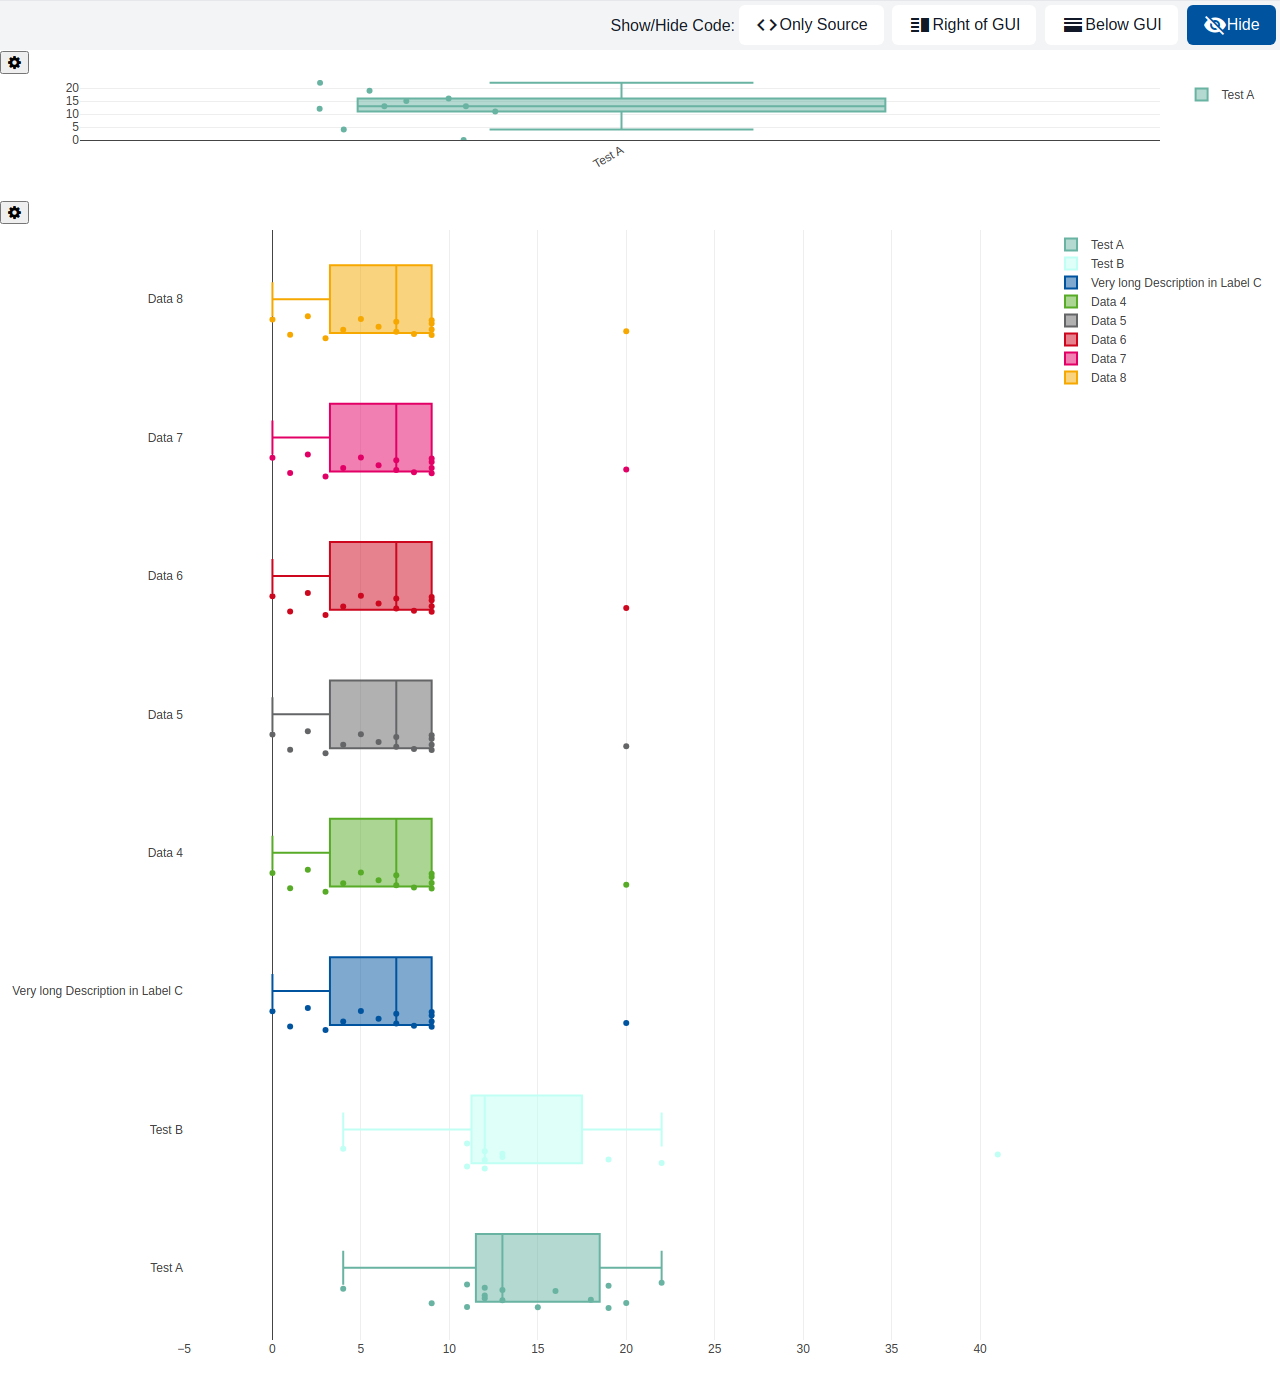
A BoxPlot presents a set of two dimensional data with a number of rectangular boxes + whiskers that represent max, min, median and upper and lower quantiles. The chart itself visualizes categories (given as Strings) on one axis and scalar values on the other as size of the boxes. Additionally, the exact data points can be visualized to get a better idea of the distribution. For example, it can be used to compare exam score distributions across several classes, or to visualize the spread of measured sensor values per device.
/* (c) https://github.com/MontiCore/monticore */
package example_charts;

import mc.fenix.charts.gemboxplottypes.GemBoxPlotBoxBuilder;
import mc.fenix.charts.gemboxplottypes.GemBoxPlotDataBuilder;
import mc.fenix.charts.gemboxplottypes.GemBoxPlotEntry;
import mc.fenix.charts.gemboxplottypes.GemBoxPlotData;
import mc.fenix.charts.gemboxplottypes.GemBoxPlotEntryBuilder;
import umlp.jsweet.extension.annotation.Component;

import java.util.Arrays;
import java.util.List;
import java.util.Optional;

@Component
public class GemBoxPlotExample extends GemBoxPlotExampleTOP {

  @Override
  public Integer getBoxPlotWidth() {
    return getData().getEntriesList().size() * 150;
  }

  @Override
  public Integer getBoxPlotHeight() {
    return getData().getEntriesList().size() * 150;
  }

  @Override
  public Integer getSecondBoxPlotWidth() {
    return getSecondData().getEntriesList().size() * 150;
  }

  @Override
  public Integer getSecondBoxPlotHeight() {
    return getSecondData().getEntriesList().size() * 150;
  }

  @Override
  public GemBoxPlotData getBoxplotData() {
    return this.getData();
  }

  @Override
  public GemBoxPlotData getSecondBoxplotData() {
    return this.getSecondData();
  }

  // Dummy data
  private GemBoxPlotData getData() {
    return new GemBoxPlotDataBuilder().entries(Arrays.asList(getData1(), getData2(), getData3(), getData4(),
        getData5(), getData6(), getData7(), getData8())).build().get();
  }

  private GemBoxPlotEntry getData1() {
    return new GemBoxPlotEntryBuilder()
        .group("Test A")
        .color(Optional.of("#69b3a2"))
        .points(Arrays.asList(12.0, 19.0, 11.0, 13.0, 12.0, 22.0, 13.0, 4.0, 15.0, 16.0, 18.0, 19.0, 20.0, 12.0, 11.0, 9.0))
        .box(new GemBoxPlotBoxBuilder()
            .median(13d)
            .lowerQuantile(11d)
            .upperQuantile(18d)
            .lowerExtreme(4d)
            .upperExtreme(22d)
            .build().get())
        .build().get();
  }

  private GemBoxPlotEntry getData2() {
    return new GemBoxPlotEntryBuilder()
        .group("Test B")
        .color(Optional.of("#BFFFF4"))
        .points(Arrays.asList(12.0, 19.0, 11.0, 13.0, 12.0, 22.0, 13.0, 4.0, 12.0, 11.0, 41.0))
        .box(new GemBoxPlotBoxBuilder()
            .median(12d)
            .lowerQuantile(12d)
            .upperQuantile(19d)
            .lowerExtreme(4d)
            .upperExtreme(41d)
            .build().get())
        .build().get();
  }

  private GemBoxPlotEntry getData3() {
    return new GemBoxPlotEntryBuilder()
        .group("Very long Description in Label C")
        .points(Arrays.asList(0d, 1d, 2d, 3d, 4d, 5d, 6d, 7d, 7d, 8d, 9d, 20d, 9d, 9d, 9d))
        .box(new GemBoxPlotBoxBuilder()
            .median(7d)
            .lowerQuantile(3d)
            .upperQuantile(9d)
            .lowerExtreme(0d)
            .upperExtreme(20d)
            .build().get())
        .build().get();
  }

  private GemBoxPlotEntry getData4() {
    return new GemBoxPlotEntryBuilder()
        .group("Data 4")
        .points(Arrays.asList(0.0, 1.0, 2.0, 3.0, 4.0, 5.0, 6.0, 7.0, 7.0, 8.0, 9.0, 20.0, 9.0, 9.0, 9.0))
        .box(new GemBoxPlotBoxBuilder()
            .median(7d)
            .lowerQuantile(3d)
            .upperQuantile(9d)
            .lowerExtreme(0d)
            .upperExtreme(20d)
            .build().get())
        .build().get();
  }

  private GemBoxPlotEntry getData5() {
    return new GemBoxPlotEntryBuilder()
        .group("Data 5")
        .points(Arrays.asList(0.0, 1.0, 2.0, 3.0, 4.0, 5.0, 6.0, 7.0, 7.0, 8.0, 9.0, 20.0, 9.0, 9.0, 9.0))
        .box(new GemBoxPlotBoxBuilder()
            .median(7d)
            .lowerQuantile(3d)
            .upperQuantile(9d)
            .lowerExtreme(0d)
            .upperExtreme(20d)
            .build().get())
        .build().get();
  }

  private GemBoxPlotEntry getData6() {
    return new GemBoxPlotEntryBuilder()
        .group("Data 6")
        .points(Arrays.asList(0.0, 1.0, 2.0, 3.0, 4.0, 5.0, 6.0, 7.0, 7.0, 8.0, 9.0, 20.0, 9.0, 9.0, 9.0))
        .box(new GemBoxPlotBoxBuilder()
            .median(7d)
            .lowerQuantile(3d)
            .upperQuantile(9d)
            .lowerExtreme(0d)
            .upperExtreme(20d)
            .build().get())
        .build().get();
  }

  private GemBoxPlotEntry getData7() {
    return new GemBoxPlotEntryBuilder()
        .group("Data 7")
        .points(Arrays.asList(0.0, 1.0, 2.0, 3.0, 4.0, 5.0, 6.0, 7.0, 7.0, 8.0, 9.0, 20.0, 9.0, 9.0, 9.0))
        .box(new GemBoxPlotBoxBuilder()
            .median(7d)
            .lowerQuantile(3d)
            .upperQuantile(9d)
            .lowerExtreme(0d)
            .upperExtreme(20d)
            .build().get())
        .build().get();
  }

  private GemBoxPlotEntry getData8() {
    return new GemBoxPlotEntryBuilder()
        .group("Data 8")
        .points(Arrays.asList(0.0, 1.0, 2.0, 3.0, 4.0, 5.0, 6.0, 7.0, 7.0, 8.0, 9.0, 20.0, 9.0, 9.0, 9.0))
        .box(new GemBoxPlotBoxBuilder()
            .median(7d)
            .lowerQuantile(3d)
            .upperQuantile(9d)
            .lowerExtreme(0d)
            .upperExtreme(20d)
            .build().get())
        .build().get();
  }

  private GemBoxPlotData getSecondData() {
    return new GemBoxPlotDataBuilder().entries(Arrays.asList(new GemBoxPlotEntryBuilder()
            .group("Test A")
            .color(Optional.of("#69b3a2"))
            .points(Arrays.asList(0d,19d,11d,13d,12d,22d,13d,4d,15d,16d))
            .box(new GemBoxPlotBoxBuilder()
                .median(13d)
                .lowerQuantile(11d)
                .upperQuantile(18d)
                .lowerExtreme(0d)
                .upperExtreme(22d)
                .build().get())
        .build().get())).build().get();
  }
}