GemHeatmapChart
Heatmap charts visualize different kinds of data, for instance temperature, in a tabular-like format. They are helpful for finding patterns, relationships between data or other kind of information. For example, it can be used to visualize average monthly temperatures across several years, or website traffic by hour of day and day of week.
Usage Example
/* (c) https://github.com/MontiCore/monticore */
package example_charts;

import domain.Person;
import mc.fenix.charts.GemHeatmapChart;
import mc.fenix.charts.GemHeatmapChartTypes.GemHeatmapChartData;
import common.ExamplePage;

page GemHeatmapChartExample(List<Person> persons) {
  @ExamplePage(
    component = @GemHeatmapChart(
      data = getData(),
      xBins = 10,
      yBins = 10,
      xLabel = "Machine Temperature [\u00B0C]",
      yLabel = "Rotation Speed [RPM]",
      showConfig = true
    ),
    basePath = "example_charts",
    componentName = "GemHeatmapChartExample"
  );
}
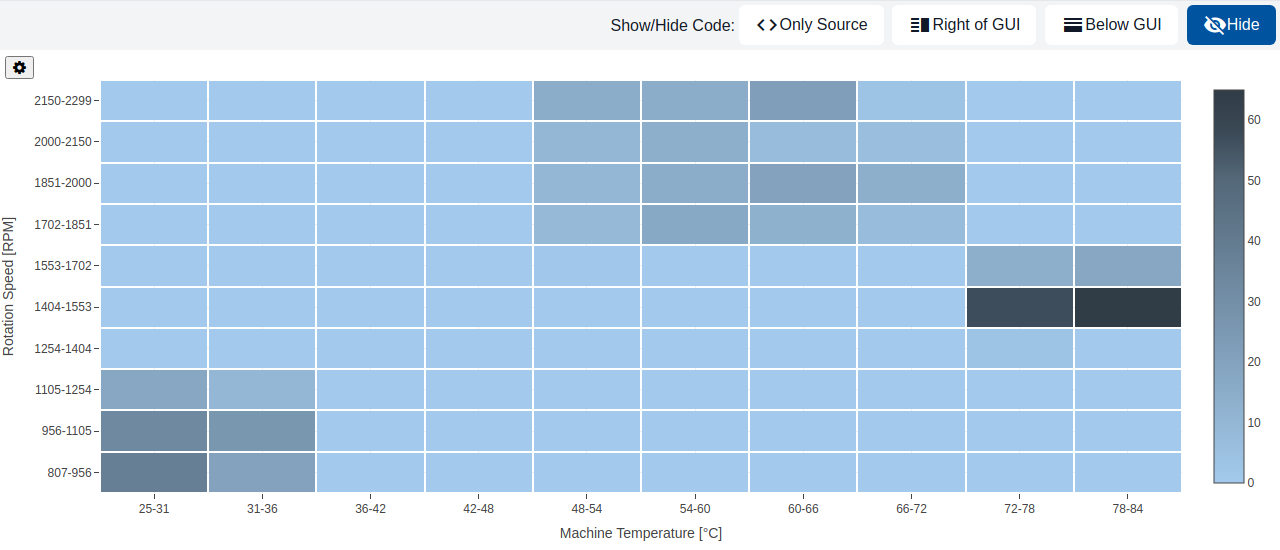
TypeScript implementation:
/* (c) https://github.com/MontiCore/monticore */
package example_charts;

import domain.Person;
import mc.fenix.charts.gemheatmapcharttypes.GemHeatmapChartData;
import mc.fenix.charts.gemheatmapcharttypes.GemHeatmapChartEntry;
import mc.fenix.charts.gemheatmapcharttypes.GemHeatmapChartEntryBuilder;
import umlp.jsweet.extension.annotation.Component;

import java.util.ArrayList;
import java.util.List;

@Component
public class GemHeatmapChartExample extends GemHeatmapChartExampleTOP {

  @Override
  public GemHeatmapChartData getData() {
    List<GemHeatmapChartEntry> entries = new ArrayList<>();
    // Generate 500 random points to show a distribution
    // Use Math.random() for JSweet compatibility
    for (int i = 0; i < 500; i++) {
      // Create some clusters
      double cluster = Math.random();
      double temp, speed;
      if (cluster < 0.3) {
        temp = 30 + (Math.random() * 10 - 5);
        speed = 1000 + (Math.random() * 400 - 200);
      } else if (cluster < 0.7) {
        temp = 60 + (Math.random() * 20 - 10);
        speed = 2000 + (Math.random() * 600 - 300);
      } else {
        temp = 80 + (Math.random() * 10 - 5);
        speed = 1500 + (Math.random() * 200 - 100);
      }
      entries.add(new GemHeatmapChartEntryBuilder()
        .xValue(temp)
        .yValue(speed)
        .build().get());
    }
    return new GemHeatmapChartData(entries);
  }

}
GUI Model
package mc.fenix.charts;

import mc.fenix.charts.GemHeatmapChartTypes.GemHeatmapChartData;

component GemHeatmapChart (
  GemHeatmapChartData data,
  String xLabel,
  String yLabel,
  Integer xBins,
  Integer yBins,
  boolean showConfig = false
)
| Name |
Type |
Description |
Default value |
data |
GemHeatmapChartData |
The data to be displayed in the chart. |
|
xLabel |
String |
Label of the horizontal axis. |
|
yLabel |
String |
Label of the vertical axis. |
|
xBins |
Integer |
Number of bins (cells) along the horizontal axis. |
|
yBins |
Integer |
Number of bins (cells) along the vertical axis. |
|
showConfig |
boolean |
Whether the chart's configuration panel is shown. |
false |
Types
GemHeatmapChartTypes
package mc.fenix.charts;
import java.util.List;

<<pojoCD>>
classdiagram GemHeatmapChartTypes {
  public class GemHeatmapChartData {
    List<GemHeatmapChartEntry> entries;
  }

  public class GemHeatmapChartEntry {
    Double xValue;
    Double yValue;
  }

}
GemHeatmapChartData
| Name |
Type |
Description |
Default value |
entries |
List<GemHeatmapChartEntry> |
|
|
GemHeatmapChartEntry
| Name |
Type |
Description |
Default value |
xValue |
Double |
|
|
yValue |
Double |
|
|