GemRadarChart
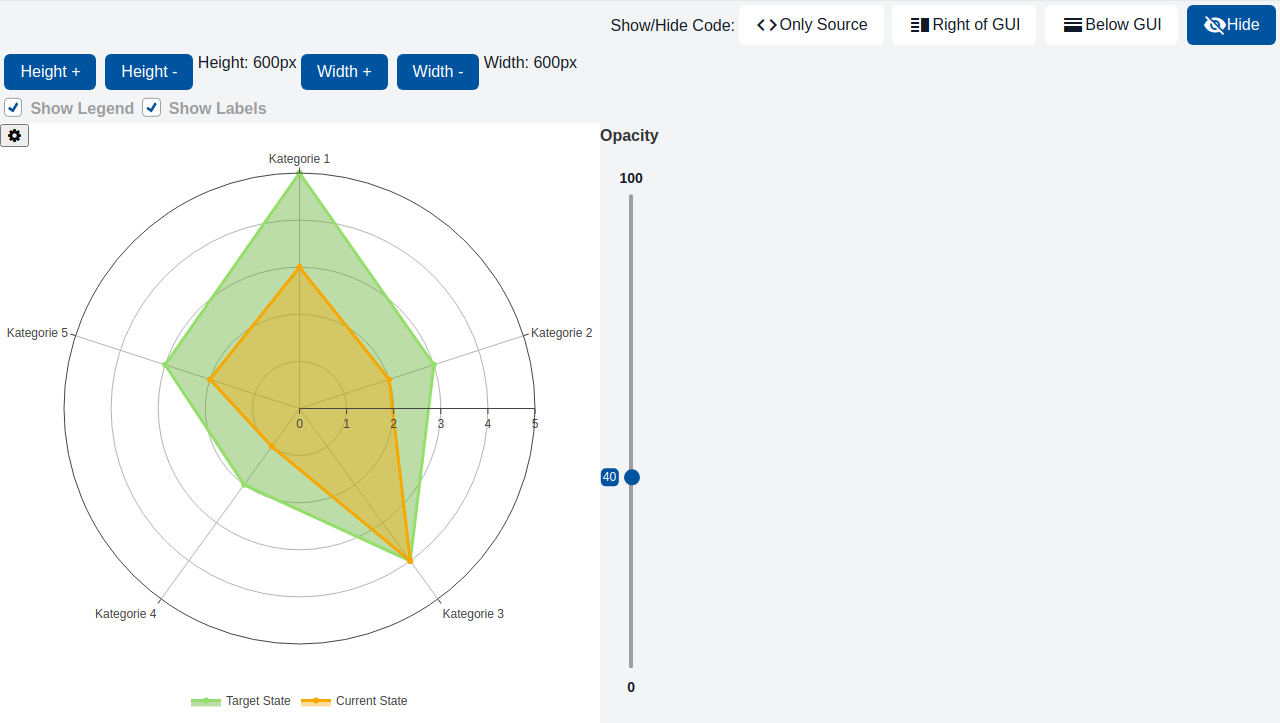
A radar chart is a way of showing multiple data points and the variation between them. They are often useful for comparing the points of two or more different data sets. For example, it can be used to compare the skill ratings of several players across multiple categories, or a product's performance across various criteria.
Usage Example
/* (c) https://github.com/MontiCore/monticore */
package example_charts;

import Domain.Person;
import mc.fenix.charts.GemRadarChart;
import mc.fenix.arrange.GemColumn;
import mc.fenix.arrange.GemRow;
import mc.fenix.basic.GemButton;
import mc.fenix.basic.GemText;
import mc.fenix.input.GemCheckBoxInput;
import mc.fenix.input.GemRangeInput;
import common.ExamplePage;

page GemRadarChartExample(
  List<Person> persons,
  String width = "600px",
  String height = "600px",
  boolean showLegend = true,
  boolean showLabels = true,
  int opacityPercent = 40
)
{
  @ExamplePage(
    component = @GemColumn(components = [
        @GemRow(wrap = "wrap", components = [
          @GemButton(label = "Height +", leftClick = changeHeight(50)),
          @GemButton(label = "Height -", leftClick = changeHeight(-50)),
          @GemText(value = "Height: " + height),
          @GemButton(label = "Width +", leftClick = changeWidth(50)),
          @GemButton(label = "Width -", leftClick = changeWidth(-50)),
          @GemText(value = "Width: " + width)
        ]),
        @GemRow(wrap = "wrap", vAlign = "center", hAlign = "left", components = [
          @GemCheckBoxInput(labelText = "Show Legend", checked = showLegend),
          @GemCheckBoxInput(labelText = "Show Labels", checked = showLabels)
        ]),
        @GemRow(
          width = "auto",
          height = height,
          components = [
            @GemColumn(
              width = width,
              components = [
                @GemRow(
                  height = "100%",
                  components = [
                    radarchart@GemRadarChart(
                      data = getData(),
                      fill = true,
                      stepSize = 1.0,
                      min = 0.0,
                      max = 5.0,
                      width = "100%",
                      height = "100%",
                      showLegend = showLegend,
                      showLabels = showLabels,
                      opacity = opacityPercent / 100.0,
                      showConfig = true
                    )
                  ]
                )
              ]
            ),
            @GemColumn(
              width = "auto",
              hAlign = "center",
              components = [
                @GemRangeInput(
                  vertical = true,
                  labelText = "Opacity",
                  minValue = 0,
                  maxValue = 100,
                  step = 10,
                  value = opacityPercent,
                  // label and min/max values need 126px, so the whole slider is as high as the chart
                  size = "calc(" + height + " - 126px)"
                )
              ]
            )
          ]
        )
    ]),
    basePath = "example_charts",
    componentName = "GemRadarChartExample"
  );
}
TypeScript implementation:
/* (c) https://github.com/MontiCore/monticore */
package example_charts;

import mc.fenix.charts.gemradarcharttypes.GemRadarChartData;
import mc.fenix.charts.gemradarcharttypes.GemRadarChartDataBuilder;
import mc.fenix.charts.gemradarcharttypes.GemRadarChartDataSetBuilder;
import umlp.jsweet.extension.annotation.Component;

import java.util.Arrays;
import java.util.Optional;
import java.util.function.Consumer;

@Component
public class GemRadarChartExample extends GemRadarChartExampleTOP {

  @Override
  public void init() {
    super.init();
  }

  @Override
  public GemRadarChartData getData() {
    GemRadarChartData data = new GemRadarChartDataBuilder()
        .labels(Arrays.asList("Kategorie 1", "Kategorie 2", "Kategorie 3", "Kategorie 4", "Kategorie 5"))
        .dataSets(Arrays.asList(
            new GemRadarChartDataSetBuilder()
                .label("Current State")
                .data(Arrays.asList(3d, 2d, 4d, 1d, 2d))
                .backgroundColor(Optional.of("rgba(246, 168, 0, 0.39)"))
                .borderColor(Optional.of("rgba(246, 168, 0, 1)"))
                .fill(Optional.of(true))
                .build().get(),
            new GemRadarChartDataSetBuilder()
                .label("Target State")
                .data(Arrays.asList(5d, 3d, 4d, 2d, 3d))
                .backgroundColor(Optional.of("rgba(87, 171, 39, 0.46)"))
                .borderColor(Optional.of("rgba(150, 222, 108, 1)"))
                .fill(Optional.of(true))
                .build().get()
        )).build().get();
    return data;
  }

  public Consumer<Void> changeWidth(int delta) {
    return v -> {
      int currentWidth = Integer.parseInt(getWidth().replace("px", ""));
      int newWidth = currentWidth + delta;
      if (newWidth < 100) newWidth = 100;
      setWidth(newWidth + "px");
    };
  }

  public Consumer<Void> changeHeight(int delta) {
    return v -> {
      int currentHeight = Integer.parseInt(getHeight().replace("px", ""));
      int newHeight = currentHeight + delta;
      if (newHeight < 100) newHeight = 100;
      setHeight(newHeight + "px");
    };
  }
}
GUI Model
component GemRadarChart(
    GemRadarChartData data,
    Optional<Integer> borderWidth,
    Boolean fill = false,
    Optional<Double> min,
    Optional<Double> max,
    Optional<Double> stepSize,
    Optional<Integer> maxLabelLength,
    Boolean showConfig = false,
    String width = "500px",
    String height = "auto",
    Boolean showLegend = true,
    Boolean showLabels = true,
    Optional<Double> opacity
)
| Name |
Type |
Description |
Default value |
data |
GemRadarChartData |
The data to be displayed in the chart. Contains labels and datasets. |
|
borderWidth |
Optional<Integer> |
The width of the line in pixels. |
|
fill |
Boolean |
If true, the area under the line will be filled. |
false |
min |
Optional<Double> |
The minimum value of the scale. |
|
max |
Optional<Double> |
The maximum value of the scale. |
|
stepSize |
Optional<Double> |
The step size of the scale. |
|
maxLabelLength |
Optional<Integer> |
Maximum length of labels. Longer labels will be truncated. |
|
showConfig |
Boolean |
If true, shows a configuration button (internal use). |
false |
width |
String |
Width of the chart container as a valid CSS length (e.g., "500px", "100%"). |
"500px" |
height |
String |
Height of the chart container as a valid CSS length (e.g., "auto", "400px"). |
"auto" |
showLegend |
Boolean |
If true, the legend is displayed. |
true |
showLabels |
Boolean |
If true, the axis labels are displayed. |
true |
opacity |
Optional<Double> |
Opacity of the fill color (0.0 to 1.0). |
|
Types
GemRadarChartTypes
package mc.fenix.charts;
import java.util.List;
import java.util.Optional;

<<pojoCD>>
classdiagram GemRadarChartTypes {

  class GemRadarChartData {
    List<GemRadarChartDataSet> dataSets;
    List<String> labels;
    Optional<Integer> maxLabelLength;
  }

  class GemRadarChartDataSet {
    List<Double> data;
    String label;
    Optional<String> backgroundColor;
    Optional<String> borderColor;
    Optional<Integer> borderWidth;
    Optional<Boolean> fill;
  }
}
GemRadarChartData
| Name |
Type |
Description |
Default value |
dataSets |
List<GemRadarChartDataSet> |
|
|
labels |
List<String> |
|
|
maxLabelLength |
Optional<Integer> |
|
|
GemRadarChartDataSet
| Name |
Type |
Description |
Default value |
data |
List<Double> |
|
|
label |
String |
|
|
backgroundColor |
Optional<String> |
|
|
borderColor |
Optional<String> |
|
|
borderWidth |
Optional<Integer> |
|
|
fill |
Optional<Boolean> |
|
|