GemGaugeChart
Gauge charts are also known as dial charts or speedometer charts. Normally they consist of a dial and a pointer, use the pointer to read the information. There are several different types of gauge charts, such as Speedometer, Linear Gauge Charts and Angular Gauge Charts. Gauge charts are very helpful to visualize and compare single data value with a quantitative context. For example, it can be used to display the current CPU usage of a server, or the fill level of a tank as a percentage of its capacity.
Usage Example
/* (c) https://github.com/MontiCore/monticore */
package example_charts;

import Domain.Person;
import mc.fenix.charts.GemGaugeChart;
import common.ExamplePage;

page GemGaugeChartExample(List<Person> persons) {
  @ExamplePage(
    component = @GemGaugeChart(
      data = getData(),
      min = 0,
      max = 50,
      unit = "#friends",
      textValue = "average number of friends for age group",
      textPosition = "bottom",
      showConfig = true
    ),
    basePath = "example_charts",
    componentName = "GemGaugeChartExample"
  );
}
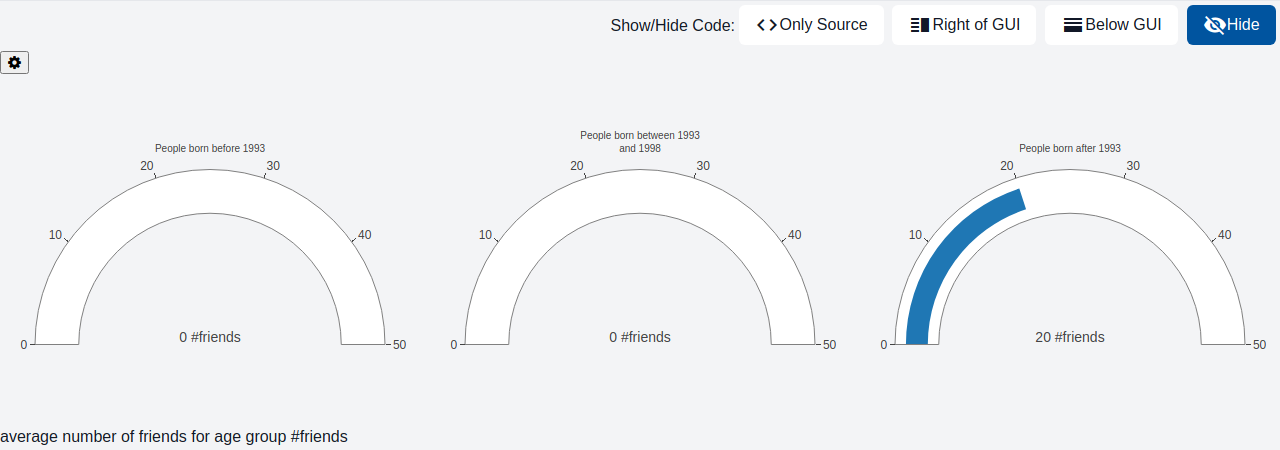
TypeScript implementation:
/* (c) https://github.com/MontiCore/monticore */
package example_charts;

//import mc.fenix.charts.gemgaugecharttypes.GemGaugeChartData;
//import mc.fenix.charts.gemgaugecharttypes.GemGaugeChartEntry;
//import mc.fenix.charts.gemgaugecharttypes.GemGaugeChartEntryBuilder;
import domain.Person;
import mc.fenix.charts.gemgaugecharttypes.GemGaugeChartData;
import mc.fenix.charts.gemgaugecharttypes.GemGaugeChartDataBuilder;
import mc.fenix.charts.gemgaugecharttypes.GemGaugeChartEntry;
import mc.fenix.charts.gemgaugecharttypes.GemGaugeChartEntryBuilder;
import umlp.jsweet.extension.annotation.Component;

import java.util.Arrays;
import java.util.List;

@Component
public class GemGaugeChartExample extends GemGaugeChartExampleTOP {

  @Override
  public GemGaugeChartData getData() {
    List<GemGaugeChartEntry> entries = Arrays.asList(
        new GemGaugeChartEntryBuilder()
            .name("People born before 1993")
            .value(0)
            .type("#friends")
            .build().get(),
        new GemGaugeChartEntryBuilder()
            .name("People born between 1993 and 1998")
            .value(0)
            .type("#friends")
            .build().get(),
        new GemGaugeChartEntryBuilder()
            .name("People born after 1993")
            .value(0)
            .type("#friends")
            .build().get()
    );

    int numberFriendsGroup1 = 0;
    int numberPeopleInGroup1 = 0;
    int numberFriendsGroup2 = 0;
    int numberPeopleInGroup2 = 0;
    int numberFriendsGroup3 = 0;
    int numberPeopleInGroup3 = 0;
    for (Person person : this.getPersons()) {
      int birthday = Integer.valueOf(person.getBirthday().toString().substring(11, 15));
      if (birthday < 1993) {
        numberFriendsGroup1 += person.getFriendsList().size();
        numberPeopleInGroup1++;
      } else if (birthday >= 1993 && birthday <= 1998) {
        numberFriendsGroup2 += person.getFriendsList().size();
        numberPeopleInGroup2++;
      } else {
        numberFriendsGroup3 += person.getFriendsList().size();
        numberPeopleInGroup3++;
      }
    }

    entries.get(0).setValue((int) Math.round((double) numberFriendsGroup1 / numberPeopleInGroup1) * 10);
    entries.get(1).setValue((int) Math.round((double) numberFriendsGroup2 / numberPeopleInGroup2) * 10);
    entries.get(2).setValue((int) Math.round((double) numberFriendsGroup3 / numberPeopleInGroup3) * 10);

    GemGaugeChartData data = new GemGaugeChartDataBuilder().entries(entries).build().get();
    return data;
  }
}
GUI Model
package mc.fenix.charts;

import mc.fenix.charts.GemGaugeChartTypes.GemGaugeChartData;

component GemGaugeChart (
  GemGaugeChartData data,
  Integer min,
  Integer max,
  String unit,
  String textValue,
  String textPosition = "center",
  boolean showConfig = false
)
| Name |
Type |
Description |
Default value |
data |
GemGaugeChartData |
The data to be displayed in the chart. |
|
min |
Integer |
The minimum value of the scale. |
|
max |
Integer |
The maximum value of the scale. |
|
unit |
String |
The unit string displayed below the value (e.g. "km/h"). |
|
textValue |
String |
The text value to display (e.g. the current value or a label). |
|
textPosition |
String |
Position of the text value. Possible values: "center" (default), "top", "bottom". |
"center" |
showConfig |
boolean |
Whether the chart's configuration panel is shown. |
false |
Types
GemGaugeChartTypes
package mc.fenix.charts;
import java.util.List;

<<pojoCD>>
classdiagram GemGaugeChartTypes {
  public class GemGaugeChartData {
    List<GemGaugeChartEntry> entries;
  }

  public class GemGaugeChartEntry {
    String type;
    String name;
    Integer value;
    String backgroundColor;
  }

}
GemGaugeChartData
| Name |
Type |
Description |
Default value |
entries |
List<GemGaugeChartEntry> |
|
|
GemGaugeChartEntry
| Name |
Type |
Description |
Default value |
type |
String |
|
|
name |
String |
|
|
value |
Integer |
|
|
backgroundColor |
String |
|
|