Charts Frontend
In this chapter
- record historical data with a second domain class
- build a dashboard page with a line, a bar and a pie chart
- calculate the chart data in hand-written frontend code
- files you touch:
models/Carrental.umlp,backend/src/main/java/carrental/CarrentalServerApplication.java,frontend/src/main/gui/gui/Dashboard.gui,frontend/src/main/java/gui/Dashboard.java,frontend/src/main/gui/gui/navigation/NavContainer.gui
Here we create a page with a bunch of charts. The process is no different from creating a normal page, but we often have to use hand-written functions.
Data for the charts
A chart needs data with a history. Add a class that records the mileage of a car
at a point in time, and an association from Car to it:
class MileageDataPoint {
  LocalDateTime recordDate;
  float mileage;
}

association [1] Car -> MileageDataPoint [*];
The association gives Car the methods addMileageDataPoint(...) and
getMileageDataPointList().
Create some data points in initEntities(). A small helper keeps the code
readable:
protected void initEntities() {
  /* customers and cars as before */

  addMileage(ford, LocalDateTime.of(2024, 7, 1, 0, 0), 800.0f);
  addMileage(ford, LocalDateTime.of(2024, 8, 1, 0, 0), 1000.0f);
  addMileage(toyota, LocalDateTime.of(2024, 7, 1, 0, 0), 60000.0f);
  addMileage(toyota, LocalDateTime.of(2024, 7, 15, 0, 0), 60500.0f);
  addMileage(toyota, LocalDateTime.of(2024, 8, 1, 0, 0), 61000.0f);
  addMileage(vw, LocalDateTime.of(2024, 7, 15, 0, 0), 2000.0f);
  addMileage(vw, LocalDateTime.of(2024, 8, 1, 0, 0), 2500.0f);
}

private void addMileage(Car car, LocalDateTime recordDate, float mileage) {
  MileageDataPoint point = CarrentalManager.mileageDataPointBuilder()
      .recordDate(recordDate)
      .mileage(mileage)
      .build()
      .get();
  car.addMileageDataPoint(point);
}
Note that the cars have data points on different dates. That is on purpose: the chart code below has to deal with gaps.
Restart the backend and update the frontend:
./gradlew :frontend:generate
The dashboard page
First, we create the following page GUI model:
package gui;

import mc.fenix.arrange.GemRow;
import mc.fenix.arrange.GemCard;
import mc.fenix.charts.GemLineChart;

import gui.navigation.NavContainer;

// data class
import Carrental.Car;

page Dashboard(List<Car> cars) {
  @NavContainer(content = [
    @GemRow(wrap = "wrap", rowGap = "10px", colGap = "10px", hAlign = "space-evenly", components = [

        @GemCard(
          width = "45%",
          height = "400px",
          title = "Mileage increase over time",
          component = @GemLineChart(data = getMileageIncrease(cars))
        )

    ])
  ]);
}
A chart takes the size of its card
A chart fills the space that its container gives it. Give the card a
height. Without one the chart has no room and is drawn over the border of
the card. Each chart card in this chapter gets height = "400px" and half of
the row as width, so the dashboard shows two charts side by side.
Add the page to the navigation bar:
@GemNavItem(title = "Dashboard", target = "/gui/Dashboard")
Add it to the navigation list in CustomerOverview.gui as well, as in the
chapter about functions in the GUI.
Charts typically have an input with a complex structure. For example,
GemLineChart expects an object of type GemLineChartData. This class diagram
is already provided by the chart library. Do not add it to your class diagram:
classdiagram GemLineChartTypes {

  public class GemLineChartData {
    List<GemLineChartEntry> entries;
    List<String> labels;
  }

  public class GemLineChartEntry {
    String label;
    List<Double> data;
    String borderColor;
    String backgroundColor;
    String pointBackgroundColor;
  }

}
labelsofGemLineChartDatarepresent points on the x axis from left to right.entriesofGemLineChartDatarepresent the statistics for each single item, in this example for each different car.labelofGemLineChartEntryrepresents the name of the item, such as the name of a car.dataofGemLineChartEntryare the y axis values that correspond to the x axis points. The size ofdatashould be equal to the size oflabelsand must be ordered according to the x axis points.
Check the types
The data of a line chart is a List<Double>, the data of a bar chart a
List<Integer>, and a pie chart entry holds a single Integer. Look at the
class diagram of the chart you use before you write the code.
Implementing the chart data
Next, we implement the function getMileageIncrease using the TOP mechanism for
the Java class Dashboard.java, which was automatically generated for us by
MontiGem. Create the file frontend/src/main/java/gui/Dashboard.java:
package gui;

import carrental.Car;
import carrental.MileageDataPoint;
import mc.fenix.charts.gemlinecharttypes.GemLineChartData;
import mc.fenix.charts.gemlinecharttypes.GemLineChartDataBuilder;
import mc.fenix.charts.gemlinecharttypes.GemLineChartEntry;
import mc.fenix.charts.gemlinecharttypes.GemLineChartEntryBuilder;
import umlp.jsweet.extension.annotation.Component;

import java.time.LocalDateTime;
import java.util.ArrayList;
import java.util.Collections;
import java.util.List;

@Component()
public class Dashboard extends DashboardTOP {

  @Override
  public GemLineChartData getMileageIncrease(List<Car> cars) {
    // if data is not present return nothing
    if (cars == null) {
      return null;
    }
    // collect all dates to use them as x axis points later
    List<LocalDateTime> dates = new ArrayList<>();
    for (Car c : cars) {
      for (MileageDataPoint mileage : c.getMileageDataPointList()) {
        dates.add(mileage.getRecordDate());
      }
    }
    // sort dates
    dates.sort((l, r) -> l.compareTo(r));

    // use string representations of the (non-repeating) dates as x axis points
    List<String> labels = new ArrayList<>();
    for (LocalDateTime date : dates) {
      String xAxisPoint = date.toString();
      if (!labels.contains(xAxisPoint)) {
        labels.add(xAxisPoint);
      }
    }

    // create an entry for each car: the label is the name of the car,
    // the data are the mileage values for each date (null where no data exists)
    List<GemLineChartEntry> entries = new ArrayList<>();
    for (Car c : cars) {
      List<Double> values = new ArrayList<>(Collections.nCopies(labels.size(), (Double) null));
      GemLineChartEntry entry = new GemLineChartEntryBuilder()
          .label(c.getMake() + " " + c.getModel() + " " + c.getName())
          .data(values)
          .build()
          .get();
      entries.add(entry);
      for (MileageDataPoint mileage : c.getMileageDataPointList()) {
        String xAxisPoint = mileage.getRecordDate().toString();
        int xAxisPointIndex = labels.indexOf(xAxisPoint);
        entry.getDataList().set(xAxisPointIndex, (double) mileage.getMileage());
      }
    }

    // optional: interpolate points where a car has no data for a date
    for (GemLineChartEntry entry : entries) {
      for (int i = 0; i < entry.getDataList().size(); ++i) {
        Double data = entry.getData(i);
        if (data == null) {
          this.interpolateData(entry.getDataList(), i);
        }
      }
    }

    return new GemLineChartDataBuilder().entries(entries).labels(labels).build().get();
  }
}
The class is not complete yet: it calls interpolateData, which we add in step 4
below.
There are several important points to be aware of:
-
A method should always check whether data is present. If it isn't, the component handles the empty output. Otherwise, if you try to access attributes of a non-existing object, the browser throws an exception which, if not caught, may break the page.
if (cars == null) { return null; } -
Then you can create the labels (x axis) of the chart. The labels are, in this case, unique dates, sorted from the earliest to the latest. The dates must also be formatted to strings to be properly displayed. The chart library recognizes the date strings and spaces them on a time axis.
-
The entries are created for each item (car) and the y axis data is inserted according to the order of the labels. The list of values must have the same length as the list of labels:
List<Double> values = new ArrayList<>(Collections.nCopies(labels.size(), (Double) null));Warning
Arrays.asList(labels.size())does not do this. It creates a list with a single element, the number itself, and writing to any other index throws anIndexOutOfBoundsException. -
The data may not be present for every point of the x axis. In that case the line of the line chart is not continuous. However, we can interpolate data if showing the data flow is more important than the actual data at specific points in time. The method
interpolateDatais also written by hand, but generally looks the same for different cases:frontend/src/main/java/gui/Dashboard.java/** * Fills the value at interpolatedIndex with a linear interpolation between the * nearest known values to the left and to the right. If there is no known value * on one side, the value of the other side is copied. */ public void interpolateData(List<Double> stat, int interpolatedIndex) { Double left = null; int leftI = -1; Double right = null; int rightI = -1; for (int i = interpolatedIndex - 1; i >= 0; --i) { if (stat.get(i) != null) { left = stat.get(i); leftI = i; break; } } for (int i = interpolatedIndex + 1; i < stat.size(); ++i) { if (stat.get(i) != null) { right = stat.get(i); rightI = i; break; } } if (left == null && right == null) { return; } if (left == null) { stat.set(interpolatedIndex, right); } else if (right == null) { stat.set(interpolatedIndex, left); } else { double step = (right - left) / (rightI - leftI); stat.set(interpolatedIndex, left + step * (interpolatedIndex - leftI)); } } -
Finally the data object is created with its builder:
return new GemLineChartDataBuilder().entries(entries).labels(labels).build().get();
More charts
Similarly we can create other charts, such as a bar chart and a pie chart:
package gui;

import mc.fenix.arrange.GemRow;
import mc.fenix.arrange.GemCard;
import mc.fenix.charts.GemLineChart;
import mc.fenix.charts.GemBarChart;
import mc.fenix.charts.GemPieChart;

import gui.navigation.NavContainer;

import Carrental.Car;

page Dashboard(List<Car> cars) {
  @NavContainer(content = [
    @GemRow(wrap = "wrap", rowGap = "10px", colGap = "10px", hAlign = "space-evenly", components = [

      @GemCard(
        width = "45%",
        height = "400px",
        title = "Mileage increase over time",
        component = @GemLineChart(data = getMileageIncrease(cars))
      ),

      @GemCard(
        width = "45%",
        height = "400px",
        title = "Average mileage",
        component = @GemBarChart(data = getMileageAvg(cars))
      ),

      @GemCard(
        width = "45%",
        height = "400px",
        title = "Availability",
        component = @GemPieChart(data = getAvailability(cars))
      )

    ])
  ]);
}
The bar chart data is similar to the line chart data, and the pie chart data has a much simpler structure:
@Override
public GemBarChartData getMileageAvg(List<Car> cars) {
  if (cars == null) {
    return null;
  }
  // one bar per car, the value is the average of its mileage data points
  List<String> labels = new ArrayList<>();
  List<Integer> averages = new ArrayList<>();
  for (Car c : cars) {
    labels.add(c.getMake() + " " + c.getModel() + " " + c.getName());
    float sum = 0;
    int count = 0;
    for (MileageDataPoint mileage : c.getMileageDataPointList()) {
      sum += mileage.getMileage();
      count++;
    }
    averages.add(count == 0 ? 0 : (int) (sum / count));
  }
  // label and stack of a bar chart entry are optional attributes
  GemBarChartEntry entry = new GemBarChartEntryBuilder()
      .label(Optional.of("Average mileage"))
      .data(averages)
      .build()
      .get();
  List<GemBarChartEntry> entries = new ArrayList<>();
  entries.add(entry);
  return new GemBarChartDataBuilder().entries(entries).labels(labels).build().get();
}

@Override
public GemPieChartData getAvailability(List<Car> cars) {
  if (cars == null) {
    return null;
  }
  int available = 0;
  int rented = 0;
  int maintenance = 0;
  for (Car c : cars) {
    if (c.getRentableStatus() == RentableStatus.AVAILABLE) {
      available++;
    } else if (c.getRentableStatus() == RentableStatus.RENTED) {
      rented++;
    } else {
      maintenance++;
    }
  }
  List<GemPieChartEntry> entries = new ArrayList<>();
  entries.add(new GemPieChartEntryBuilder().label("available").value(available).build().get());
  entries.add(new GemPieChartEntryBuilder().label("rented").value(rented).build().get());
  entries.add(new GemPieChartEntryBuilder().label("maintenance").value(maintenance).build().get());
  return new GemPieChartDataBuilder().entries(entries).build().get();
}
The additional imports are:
import carrental.RentableStatus;
import mc.fenix.charts.gembarcharttypes.GemBarChartData;
import mc.fenix.charts.gembarcharttypes.GemBarChartDataBuilder;
import mc.fenix.charts.gembarcharttypes.GemBarChartEntry;
import mc.fenix.charts.gembarcharttypes.GemBarChartEntryBuilder;
import mc.fenix.charts.gempiecharttypes.GemPieChartData;
import mc.fenix.charts.gempiecharttypes.GemPieChartDataBuilder;
import mc.fenix.charts.gempiecharttypes.GemPieChartEntry;
import mc.fenix.charts.gempiecharttypes.GemPieChartEntryBuilder;
import java.util.Optional;
Apply the changes:
./gradlew :frontend:generate
The result:
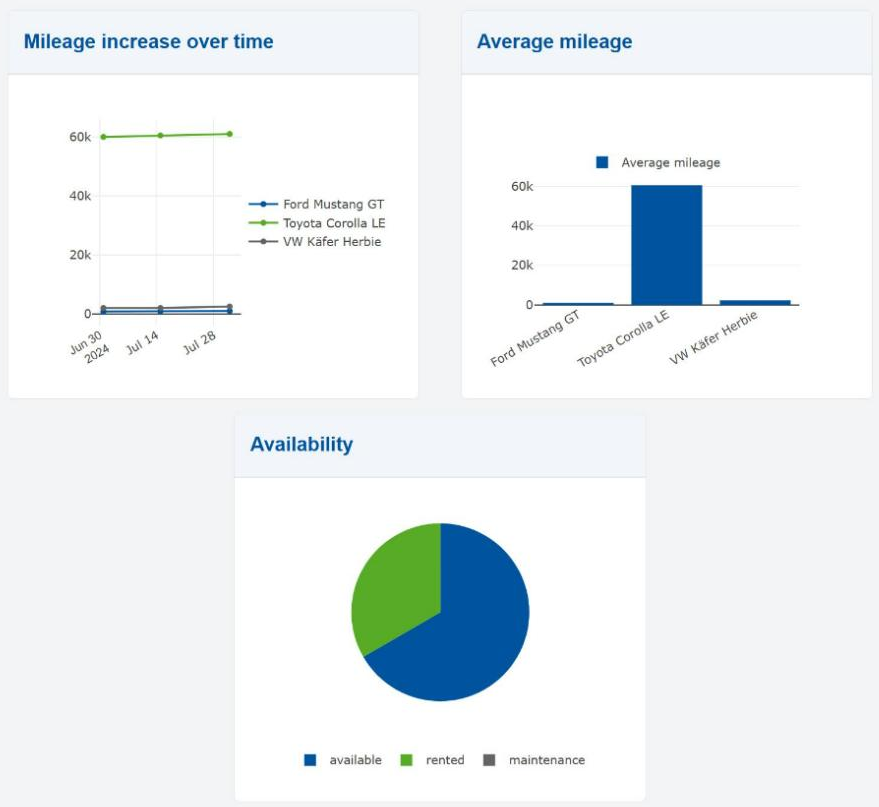
Known issue: the dates are shifted
The frontend shifts every LocalDateTime by the offset of your time zone.
In Germany the line chart therefore starts on June 30 instead of July 1.
The chart from the next chapter is calculated in the
backend and shows the right dates.
You can take a look at the documentation for library components to get a general idea about structuring the data of other chart types.
Checkpoint
- The navigation bar has an entry "Dashboard".
- http://localhost:4200/gui/Dashboard shows three cards. The line chart has one line per car, the bar chart one bar per car, the pie chart the three status values.
- Rent a car on the car overview page and go back to the dashboard: the pie chart has changed.